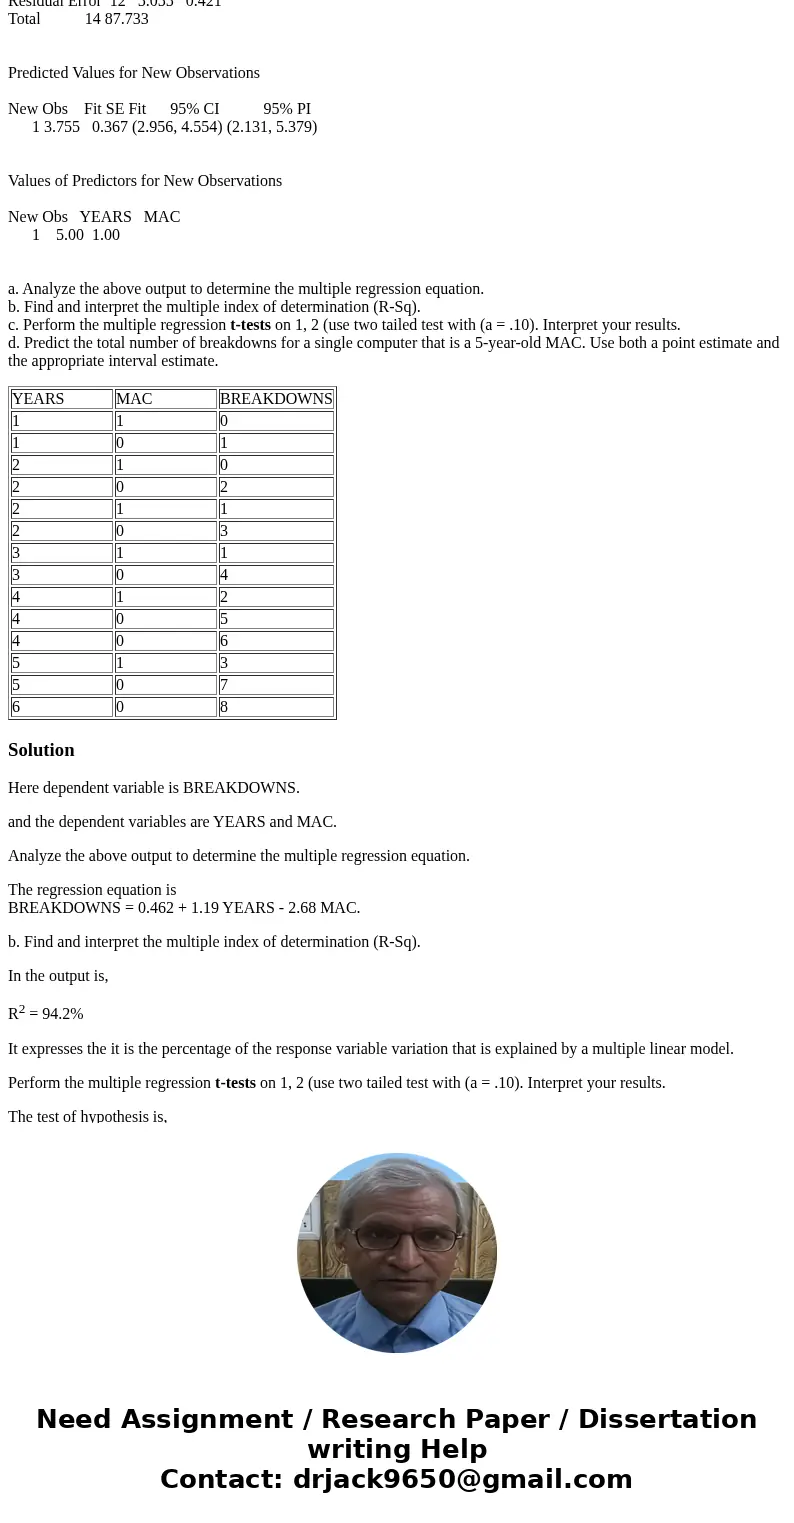
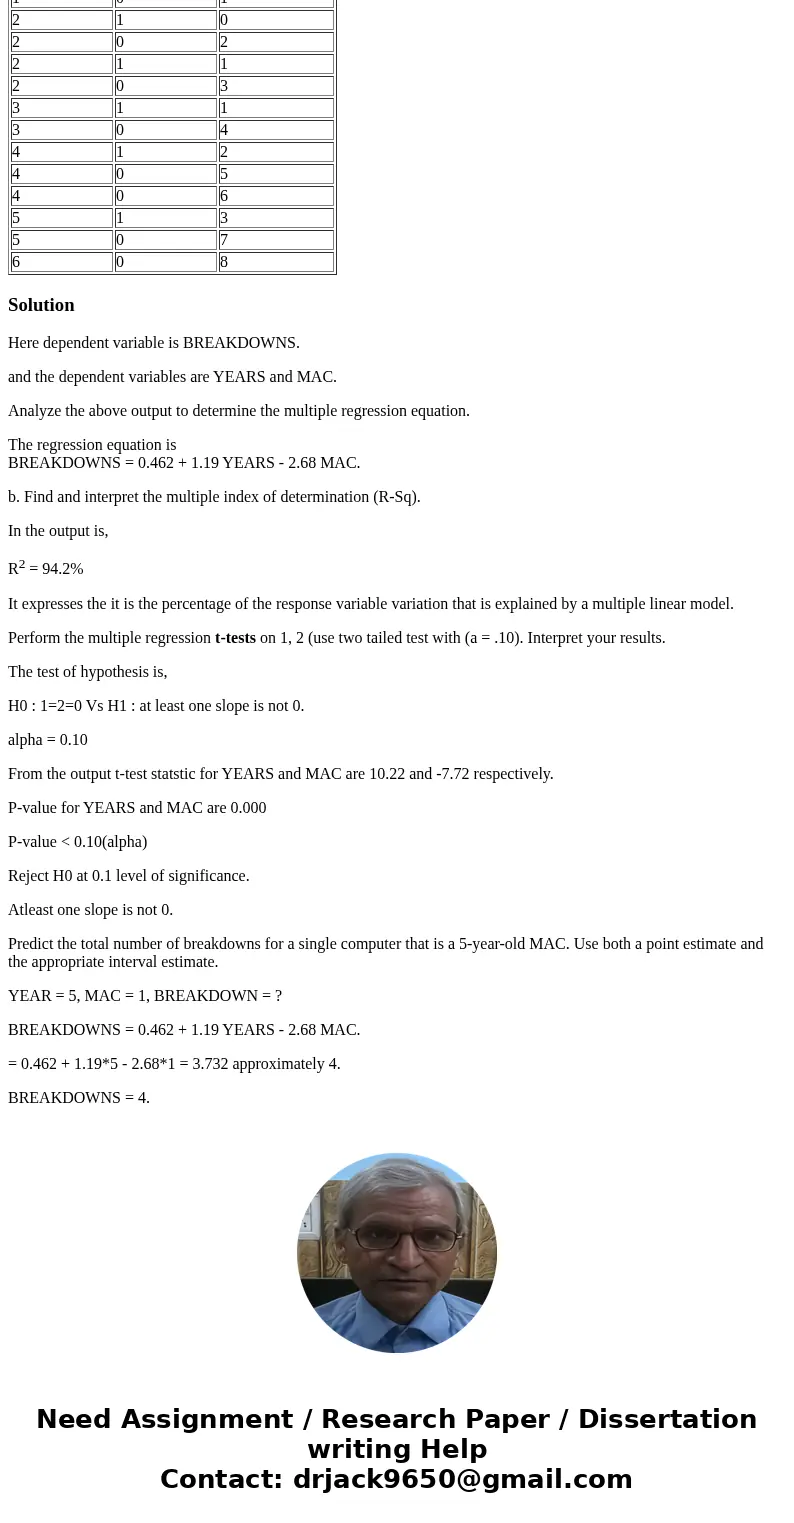
A sample of 15 computers reveals the following data in years
A sample of 15 computers reveals the following data in years of service (X1, YEARS), whether the computer is a MAC or not (X2, 1=Mac computer, 0=not a Mac computer), and the total number of breakdowns (Y, BREAKDOWNS). The results are found below.
YEARS
MAC
BREAKDOWNS
1
1
0
1
0
1
2
1
0
2
0
2
2
1
1
2
0
3
3
1
1
3
0
4
4
1
2
4
0
5
4
0
6
5
1
3
5
0
7
6
0
8
Correlations: YEARS, MAC, BREAKDOWNS
YEARS MAC
MAC -0.168
0.549
BREAKDOWNS 0.810 -0.664
0.000 0.007
Cell Contents: Pearson correlation
P-Value
Regression Analysis: BREAKDOWNS versus YEARS, MAC
The regression equation is
BREAKDOWNS = 0.462 + 1.19 YEARS - 2.68 MAC.
Predictor Coef SE Coef T P
Constant 0.4625 0.4456 1.04 0.320
YEARS 1.1946 0.1169 10.22 0.000
MAC -2.6805 0.3470 -7.72 0.000
S = 0.649016 R-Sq = 94.2% R-Sq(adj) = 93.3%
Analysis of Variance
Source DF SS MS F P
Regression 2 82.679 41.339 98.14 0.000
Residual Error 12 5.055 0.421
Total 14 87.733
Predicted Values for New Observations
New Obs Fit SE Fit 95% CI 95% PI
1 3.755 0.367 (2.956, 4.554) (2.131, 5.379)
Values of Predictors for New Observations
New Obs YEARS MAC
1 5.00 1.00
a. Analyze the above output to determine the multiple regression equation.
b. Find and interpret the multiple index of determination (R-Sq).
c. Perform the multiple regression t-tests on 1, 2 (use two tailed test with (a = .10). Interpret your results.
d. Predict the total number of breakdowns for a single computer that is a 5-year-old MAC. Use both a point estimate and the appropriate interval estimate.
| YEARS | MAC | BREAKDOWNS |
| 1 | 1 | 0 |
| 1 | 0 | 1 |
| 2 | 1 | 0 |
| 2 | 0 | 2 |
| 2 | 1 | 1 |
| 2 | 0 | 3 |
| 3 | 1 | 1 |
| 3 | 0 | 4 |
| 4 | 1 | 2 |
| 4 | 0 | 5 |
| 4 | 0 | 6 |
| 5 | 1 | 3 |
| 5 | 0 | 7 |
| 6 | 0 | 8 |
Solution
Here dependent variable is BREAKDOWNS.
and the dependent variables are YEARS and MAC.
Analyze the above output to determine the multiple regression equation.
The regression equation is
BREAKDOWNS = 0.462 + 1.19 YEARS - 2.68 MAC.
b. Find and interpret the multiple index of determination (R-Sq).
In the output is,
R2 = 94.2%
It expresses the it is the percentage of the response variable variation that is explained by a multiple linear model.
Perform the multiple regression t-tests on 1, 2 (use two tailed test with (a = .10). Interpret your results.
The test of hypothesis is,
H0 : 1=2=0 Vs H1 : at least one slope is not 0.
alpha = 0.10
From the output t-test statstic for YEARS and MAC are 10.22 and -7.72 respectively.
P-value for YEARS and MAC are 0.000
P-value < 0.10(alpha)
Reject H0 at 0.1 level of significance.
Atleast one slope is not 0.
Predict the total number of breakdowns for a single computer that is a 5-year-old MAC. Use both a point estimate and the appropriate interval estimate.
YEAR = 5, MAC = 1, BREAKDOWN = ?
BREAKDOWNS = 0.462 + 1.19 YEARS - 2.68 MAC.
= 0.462 + 1.19*5 - 2.68*1 = 3.732 approximately 4.
BREAKDOWNS = 4.


 Homework Sourse