Data Entry Dr Cooper believes that performance on statistics
Data Entry
Dr. Cooper believes that performance on statistics exams is related to ACT scores. He has collected relevant info about ACT and exam scores (listed below). He has also recorded each student’s gender. Open SPSS and enter these data into a new data file (use the instructions below). Include the variable names, variable labels, and value labels (if applicable) into a blank SPSS data file. Then, in the cells below each variable, carefully enter the data below. After all of the data is entered, sort the data so all of the males are listed first,
Gender: 1=male, 2=female
ACT: Score on ACT test
Score: Score on stats test 1
Gender
ACT
Score
1
33
98.00
2
27
77.00
1
26
75.00
2
31
90.00
1
23
62.00
2
29
81.00
1
25
72.00
2
26
74.00
1
25
70.00
2
29
90.00
1
27
2
30
89.00
1
24
70.00
2
28
82.00
1
26
74.00
2
25
60.00
1
26
76.00
2
32
91.00
1
29
89.00
2
28
Summation Notation
Let X=ACT scores and Y= Stats exam scores and complete the following:
n = __________________
X = ________________
(X)2= ______________
(X2) = ______________
Y = ________________
(Y)2= ______________
(Y2) =_______________
(XY) = ______________
(XY)2= ______________
Descriptive Statistics
Use SPSS to determine the descriptive statistics of the dataset. Use the instructions provided to conduct your analysis.
ACT
SCORE
MEAN
MEDIAN
MODE
STANDARD DEVIATION
Is distribution skewed??
Y N
If yes: + skew - skew
Y N
If yes: + skew - skew
Discuss why the distribution IS or IS NOT skewed (positively or negatively).
Sample data
Add the following columns to your dataset and determine the mean median, mode, and standard deviation for GPA and STATS (Final Exam Scores). Based on this information describe the dataset. Specifically, what can you tell about the data and the distribution for GPA and STATS?
GPA: Student GPA
STATS: Score on stats exam 1
GPA
STATS
4.00
94
3.31
84
2.95
77
3.50
93
2.00
84
3.10
81
3.14
82
2.98
74
2.30
69
3.70
91
3.65
66
2.87
76
2.20
63
2.70
82
2.99
76
3.60
62
3.23
74
3.98
90
3.75
89
3.50
83
Discuss findings for…
6.) GPA:
7.) STATS:
| Gender | ACT | Score |
| 1 | 33 | 98.00 |
| 2 | 27 | 77.00 |
| 1 | 26 | 75.00 |
| 2 | 31 | 90.00 |
| 1 | 23 | 62.00 |
| 2 | 29 | 81.00 |
| 1 | 25 | 72.00 |
| 2 | 26 | 74.00 |
| 1 | 25 | 70.00 |
| 2 | 29 | 90.00 |
| 1 | 27 | 81.00 |
| 2 | 30 | 89.00 |
| 1 | 24 | 70.00 |
| 2 | 28 | 82.00 |
| 1 | 26 | 74.00 |
| 2 | 25 | 60.00 |
| 1 | 26 | 76.00 |
| 2 | 32 | 91.00 |
| 1 | 29 | 89.00 |
| 2 | 28 | 82.00 |
Solution
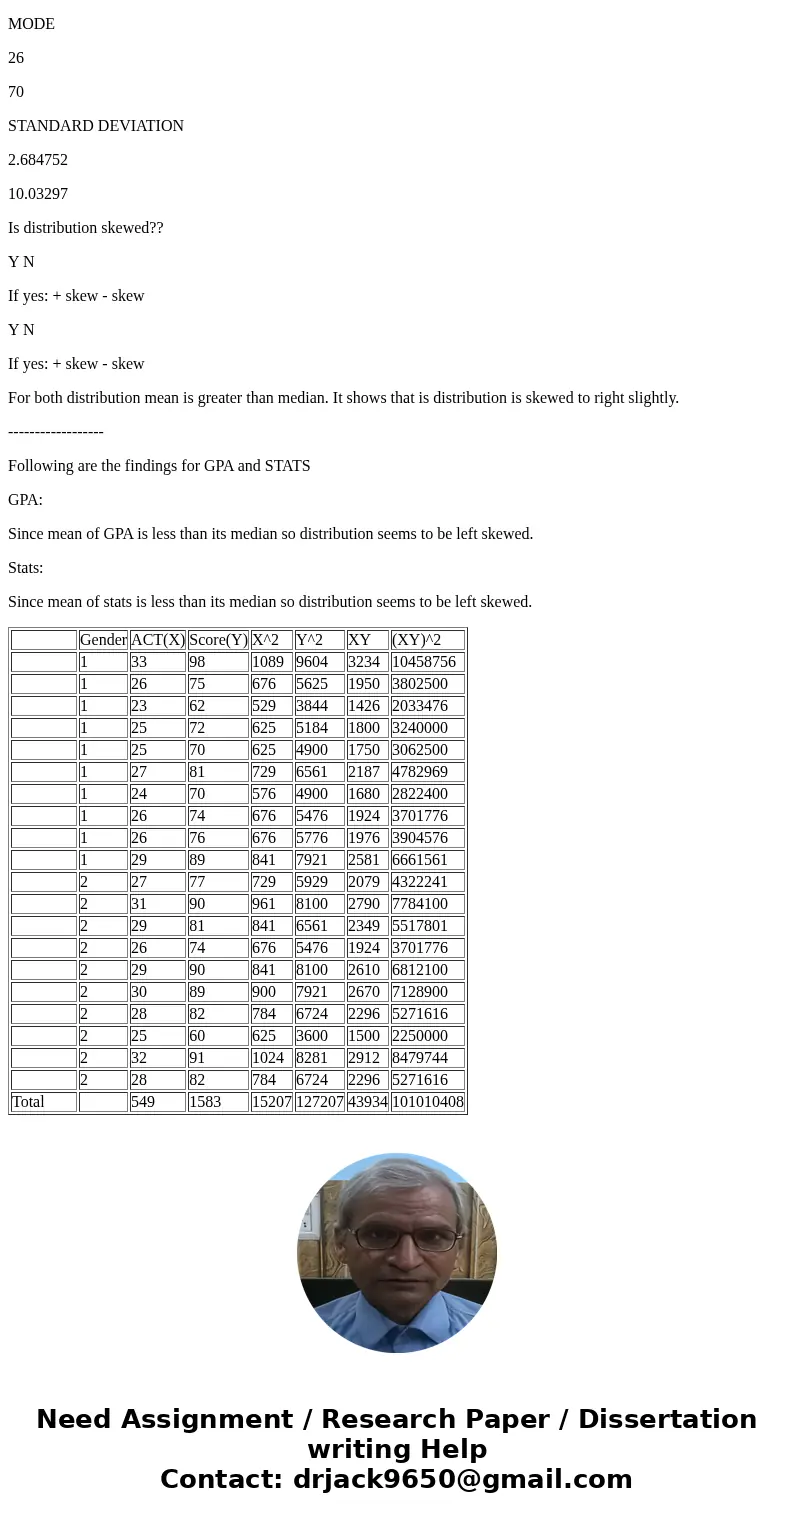
Follwoing is the ordered data set:
n =20
X = 549
(X)2 = 549*549=301401
(X2) =15207
Y = 1583
(Y)2 = 1583*1583=2505889
(Y2) =127207
(XY) = 43934
(XY)2 = 43934*43934=1930196356
-----------------------
Descriptive Statistics
ACT
SCORE
MEAN
27.45
79.15
MEDIAN
27
79
MODE
26
70
STANDARD DEVIATION
2.684752
10.03297
Is distribution skewed??
Y N
If yes: + skew - skew
Y N
If yes: + skew - skew
For both distribution mean is greater than median. It shows that is distribution is skewed to right slightly.
------------------
Following are the findings for GPA and STATS
GPA:
Since mean of GPA is less than its median so distribution seems to be left skewed.
Stats:
Since mean of stats is less than its median so distribution seems to be left skewed.
| Gender | ACT(X) | Score(Y) | X^2 | Y^2 | XY | (XY)^2 | |
| 1 | 33 | 98 | 1089 | 9604 | 3234 | 10458756 | |
| 1 | 26 | 75 | 676 | 5625 | 1950 | 3802500 | |
| 1 | 23 | 62 | 529 | 3844 | 1426 | 2033476 | |
| 1 | 25 | 72 | 625 | 5184 | 1800 | 3240000 | |
| 1 | 25 | 70 | 625 | 4900 | 1750 | 3062500 | |
| 1 | 27 | 81 | 729 | 6561 | 2187 | 4782969 | |
| 1 | 24 | 70 | 576 | 4900 | 1680 | 2822400 | |
| 1 | 26 | 74 | 676 | 5476 | 1924 | 3701776 | |
| 1 | 26 | 76 | 676 | 5776 | 1976 | 3904576 | |
| 1 | 29 | 89 | 841 | 7921 | 2581 | 6661561 | |
| 2 | 27 | 77 | 729 | 5929 | 2079 | 4322241 | |
| 2 | 31 | 90 | 961 | 8100 | 2790 | 7784100 | |
| 2 | 29 | 81 | 841 | 6561 | 2349 | 5517801 | |
| 2 | 26 | 74 | 676 | 5476 | 1924 | 3701776 | |
| 2 | 29 | 90 | 841 | 8100 | 2610 | 6812100 | |
| 2 | 30 | 89 | 900 | 7921 | 2670 | 7128900 | |
| 2 | 28 | 82 | 784 | 6724 | 2296 | 5271616 | |
| 2 | 25 | 60 | 625 | 3600 | 1500 | 2250000 | |
| 2 | 32 | 91 | 1024 | 8281 | 2912 | 8479744 | |
| 2 | 28 | 82 | 784 | 6724 | 2296 | 5271616 | |
| Total | 549 | 1583 | 15207 | 127207 | 43934 | 101010408 |


 Homework Sourse