You are an investor with a large sum of money or a company l
You are an investor with a large sum of money (or a company looking for an investment), and buying either Home Depot or shares of stock in Home Depot. Determine, based on the company’s financials and its future business prospects, whether you will invest in this company or not.
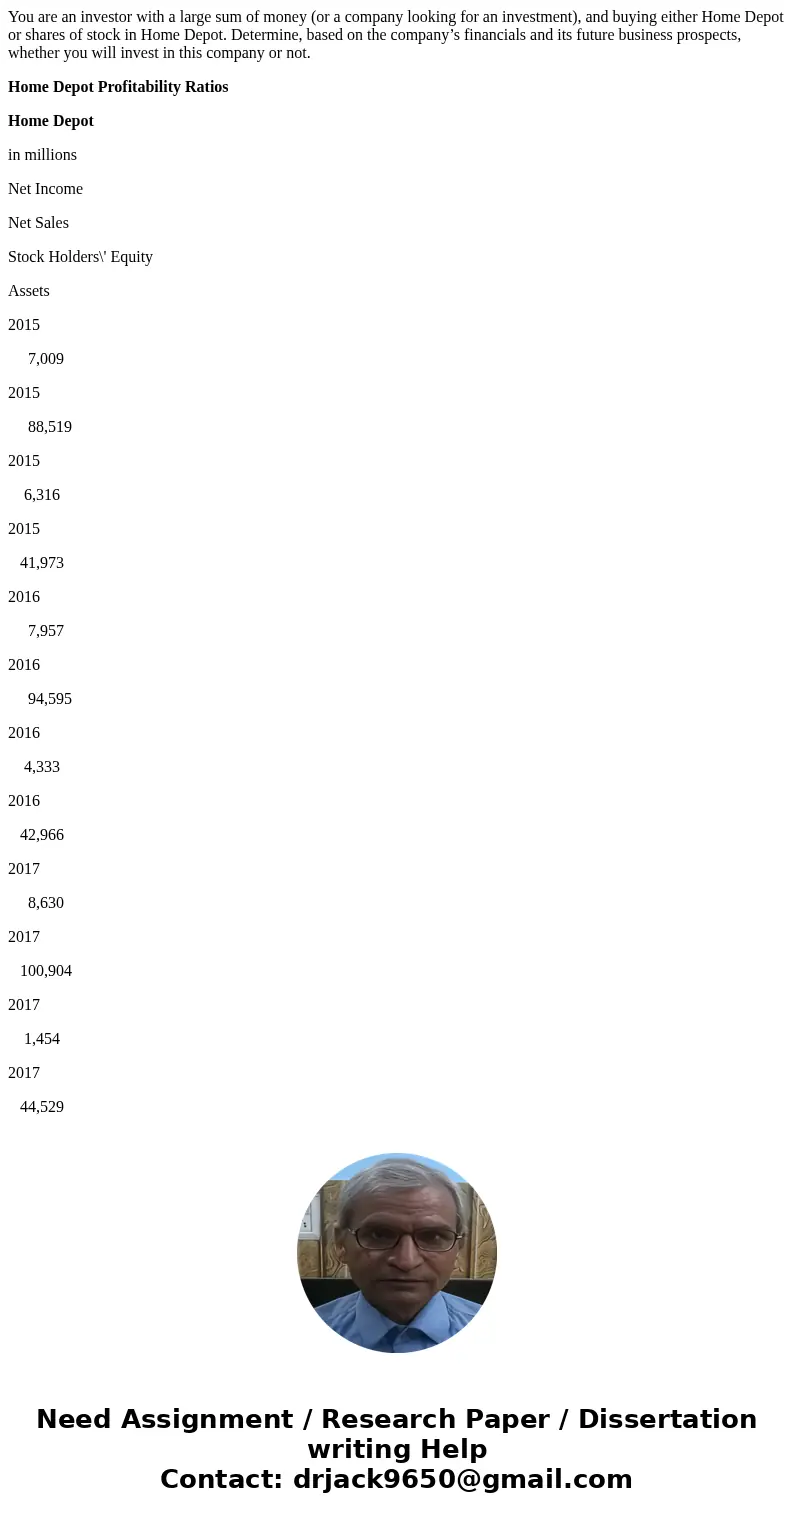
Home Depot Profitability Ratios
Home Depot
in millions
Net Income
Net Sales
Stock Holders\' Equity
Assets
2015
7,009
2015
88,519
2015
6,316
2015
41,973
2016
7,957
2016
94,595
2016
4,333
2016
42,966
2017
8,630
2017
100,904
2017
1,454
2017
44,529
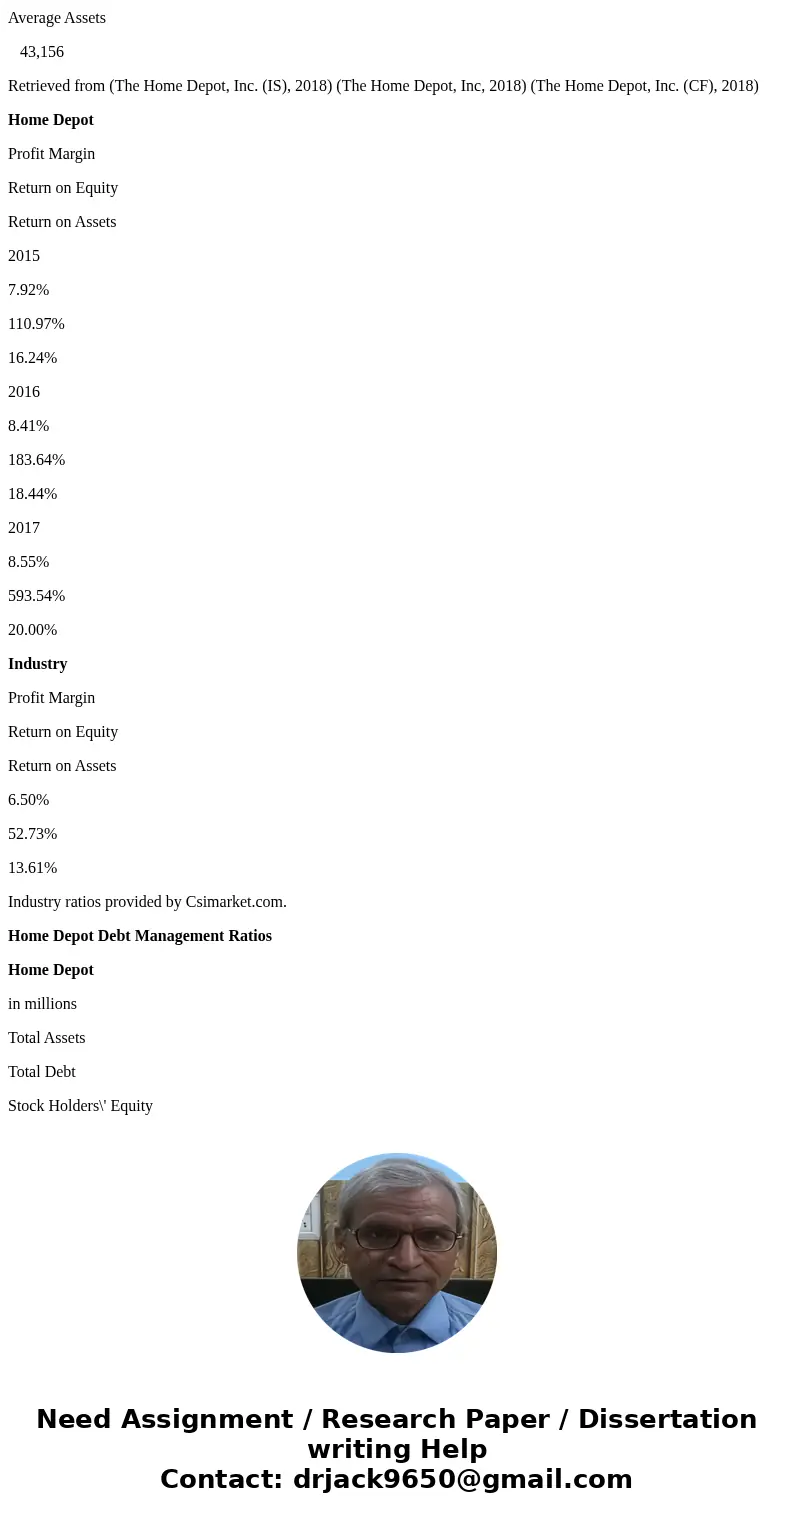
Average Assets
43,156
Retrieved from (The Home Depot, Inc. (IS), 2018) (The Home Depot, Inc, 2018) (The Home Depot, Inc. (CF), 2018)
Home Depot
Profit Margin
Return on Equity
Return on Assets
2015
7.92%
110.97%
16.24%
2016
8.41%
183.64%
18.44%
2017
8.55%
593.54%
20.00%
Industry
Profit Margin
Return on Equity
Return on Assets
6.50%
52.73%
13.61%
Industry ratios provided by Csimarket.com.
Home Depot Debt Management Ratios
Home Depot
in millions
Total Assets
Total Debt
Stock Holders\' Equity
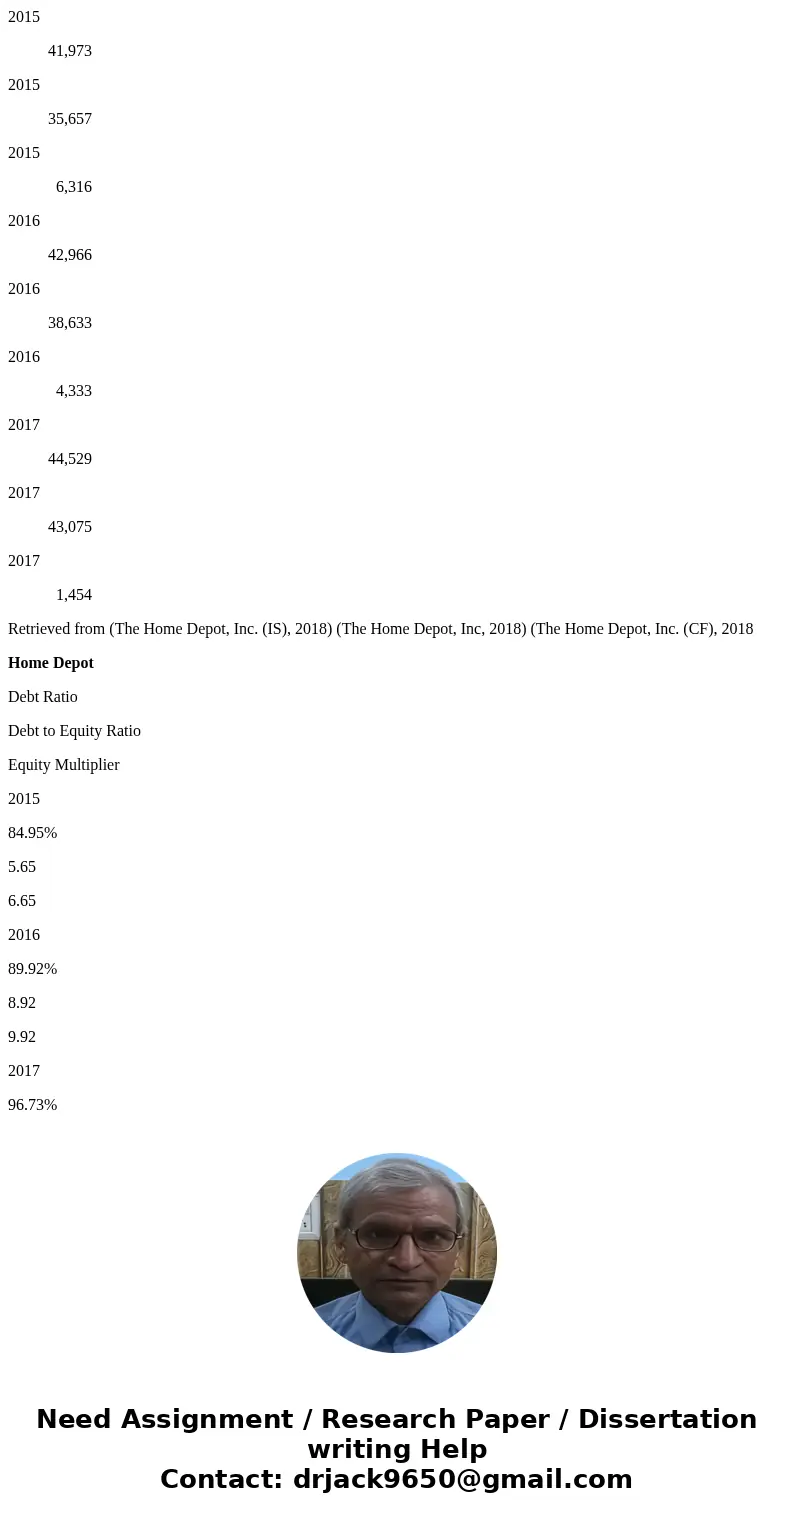
2015
41,973
2015
35,657
2015
6,316
2016
42,966
2016
38,633
2016
4,333
2017
44,529
2017
43,075
2017
1,454
Retrieved from (The Home Depot, Inc. (IS), 2018) (The Home Depot, Inc, 2018) (The Home Depot, Inc. (CF), 2018
Home Depot
Debt Ratio
Debt to Equity Ratio
Equity Multiplier
2015
84.95%
5.65
6.65
2016
89.92%
8.92
9.92
2017
96.73%
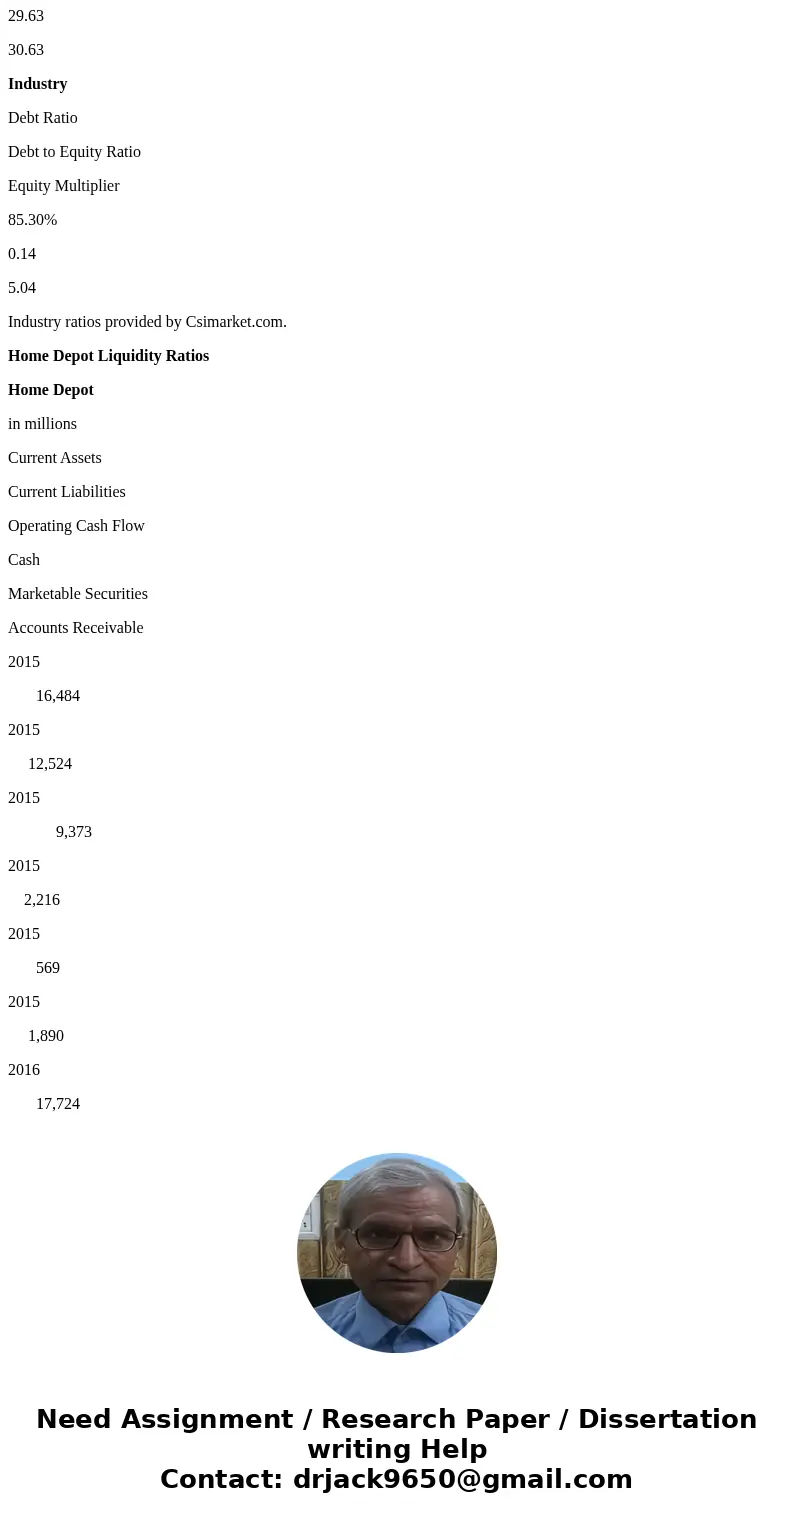
29.63
30.63
Industry
Debt Ratio
Debt to Equity Ratio
Equity Multiplier
85.30%
0.14
5.04
Industry ratios provided by Csimarket.com.
Home Depot Liquidity Ratios
Home Depot
in millions
Current Assets
Current Liabilities
Operating Cash Flow
Cash
Marketable Securities
Accounts Receivable
2015
16,484
2015
12,524
2015
9,373
2015
2,216
2015
569
2015
1,890
2016
17,724
2016
14,133
2016
9,783
2016
2,538
2016
608
2016
2,029
2017
18,933
2017
16,194
2017
12,031
2017
3,595
2017
638
2017
1,952
Retrieved from (The Home Depot, Inc. (IS), 2018) (The Home Depot, Inc, 2018) (The Home Depot, Inc. (CF), 2018)
Home Depot
Current Ratio
Quick Ratio
Operating Cash Flow Ratio
2015
1.32
0.37
0.75
2016
1.25
0.37
0.69
2017
1.17
0.38
0.74
Industry
Current Ratio
Quick Ratio
Operating Cash Flow Ratio
1.13
0.15
0.59
Solution
1. Profitability:
The net profit margin (Net income/Sales), ROE( Net income/Total Equity)and ROA (Net Income/Total Assets) have increased over the previous years and all these ratios are higher than industry standard showing that the profitability of the firm is higher than the industry average. The margins of Home Depot are better hence making it more attractive.
2. The debt ratio (Total Debt/Total Assets), Debt Equity ratio and Equity Multiplier (Total Assets/Total Equity) are increasing and higher than industry average. This indicates that Home depot is more leveraged and has more risk than the industry. This indicates that Home depot will struggle during downturn however till the company is performing higher debt ratio is not worry.
3. The cash flow situation which is indicated by quick ratio is better than industry and also more cash flow is generated from operating activity showing that liquidity is not a problem for the problem.
Based on the above analysis I would recommend investing in Home Depot
Best of Luck. God Bless
 Homework Sourse