Q2 Correlation studies are also often used to help us learn
Q2) Correlation studies are also often used to help us learn more about certain human factors by determining if and how those factors are related to other factors. Understanding such relations can, at times, be our first step to addressing important human factors we want to improve change, such as life expectancy. Using the following data extracted from The World Almanac and Book of Facts, you will investigate the relationship between life expectancy in various countries and two other factors: density of people per television, and density of physicians.
70.5
a) Without looking too closely at the data, make a conjecture as to whether any relationship exists between a country\'s life expectancy and its density of people per television set, and, if so, whether the association is positive or negative. (You will receive full points on this question for simply making a conjecture, not for whether it is accurate).
b) Again, without looking too closely at the data, make a conjecture as to whether any relationship exists between a country\'s life expectancy and its density of physicians, and, if so, whether the association is positive or negative. (You will receive full points on this question for simply making a conjecture, not for whether it is accurate).
c) Compute the correlation between life expectancy and density of people per television. Also explain the direction and magnitude (magnitude is also often called strength) of the relationship.
d) Compute the correlation between life expectancy and density of people per physician. Also explain the direction and magnitude (magnitude is also often called strength) of the relationship.
e) Based on the two correlations, what appears to influence life expectancy? And, how do you explain your results? (Hint: Read pp. 82 – 83 of your textbook).
Scoring rubric:
Problem 2a (1.5 points): Prediction not given, or missing direction and/or magnitude (minus 1 point)
Problem 2b (1.5 points): Prediction not given, or missing direction and/or magnitude (minus 1 point)
Problem 2c (7 points) (Must show all work starting with formula and indicating means, standard deviations and value for r): Deduct as follows:
Incorrect Mean for Life Expectancy (minus 1 point)
Incorrect Mean for People per Television (minus 1 point)
Incorrect SD for Life Expectancy (minus 1 point)
Incorrect SD for Birth Parents (minus 1 point)
Incorrect value for r (minus 1 point)
Incorrect/absent sentence about a) direction and magnitude of correlation (minus 1 point each, total of 2 points)
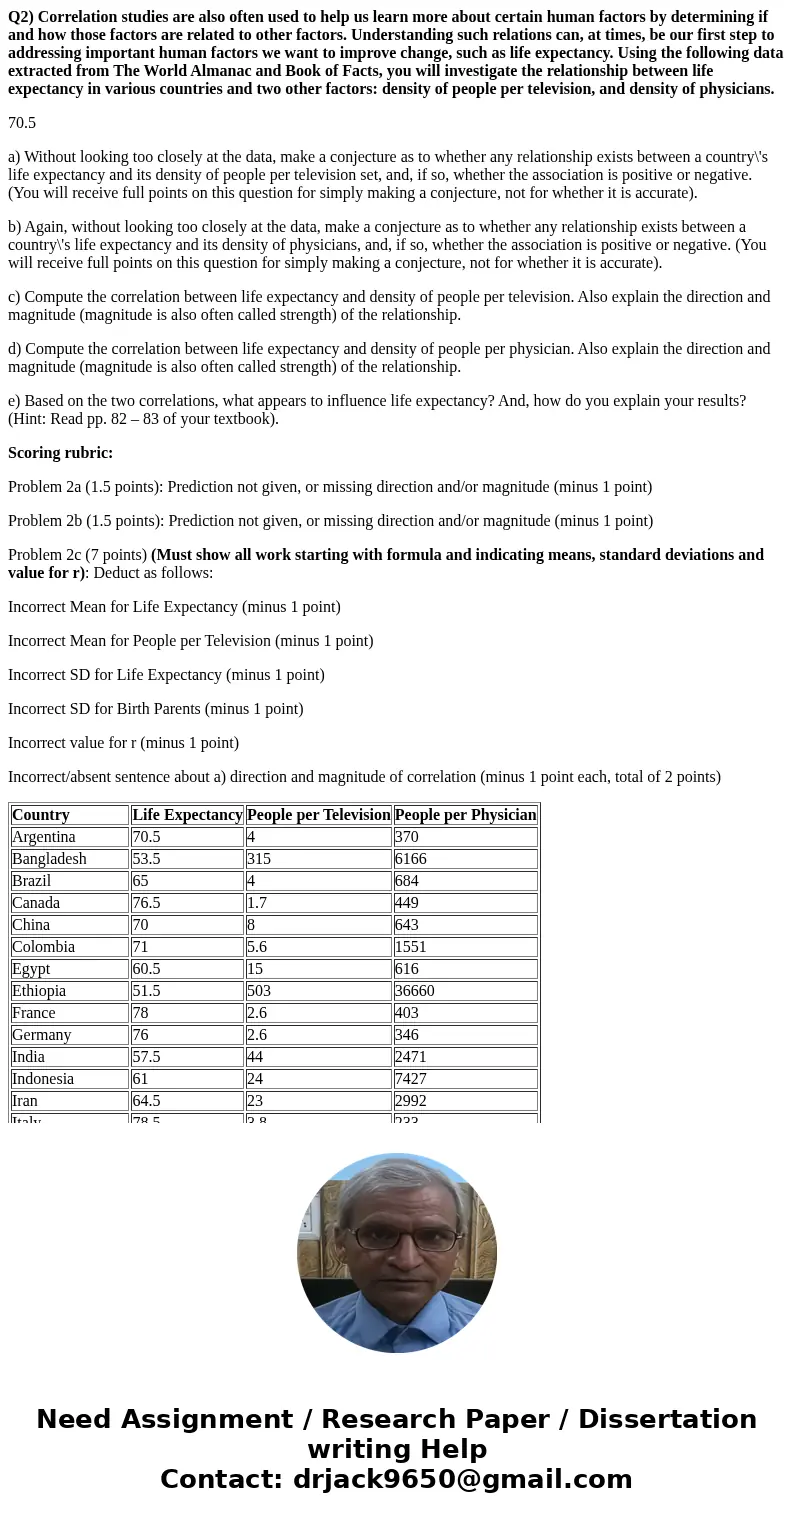
| Country | Life Expectancy | People per Television | People per Physician |
| Argentina | 70.5 | 4 | 370 |
| Bangladesh | 53.5 | 315 | 6166 |
| Brazil | 65 | 4 | 684 |
| Canada | 76.5 | 1.7 | 449 |
| China | 70 | 8 | 643 |
| Colombia | 71 | 5.6 | 1551 |
| Egypt | 60.5 | 15 | 616 |
| Ethiopia | 51.5 | 503 | 36660 |
| France | 78 | 2.6 | 403 |
| Germany | 76 | 2.6 | 346 |
| India | 57.5 | 44 | 2471 |
| Indonesia | 61 | 24 | 7427 |
| Iran | 64.5 | 23 | 2992 |
| Italy | 78.5 | 3.8 | 233 |
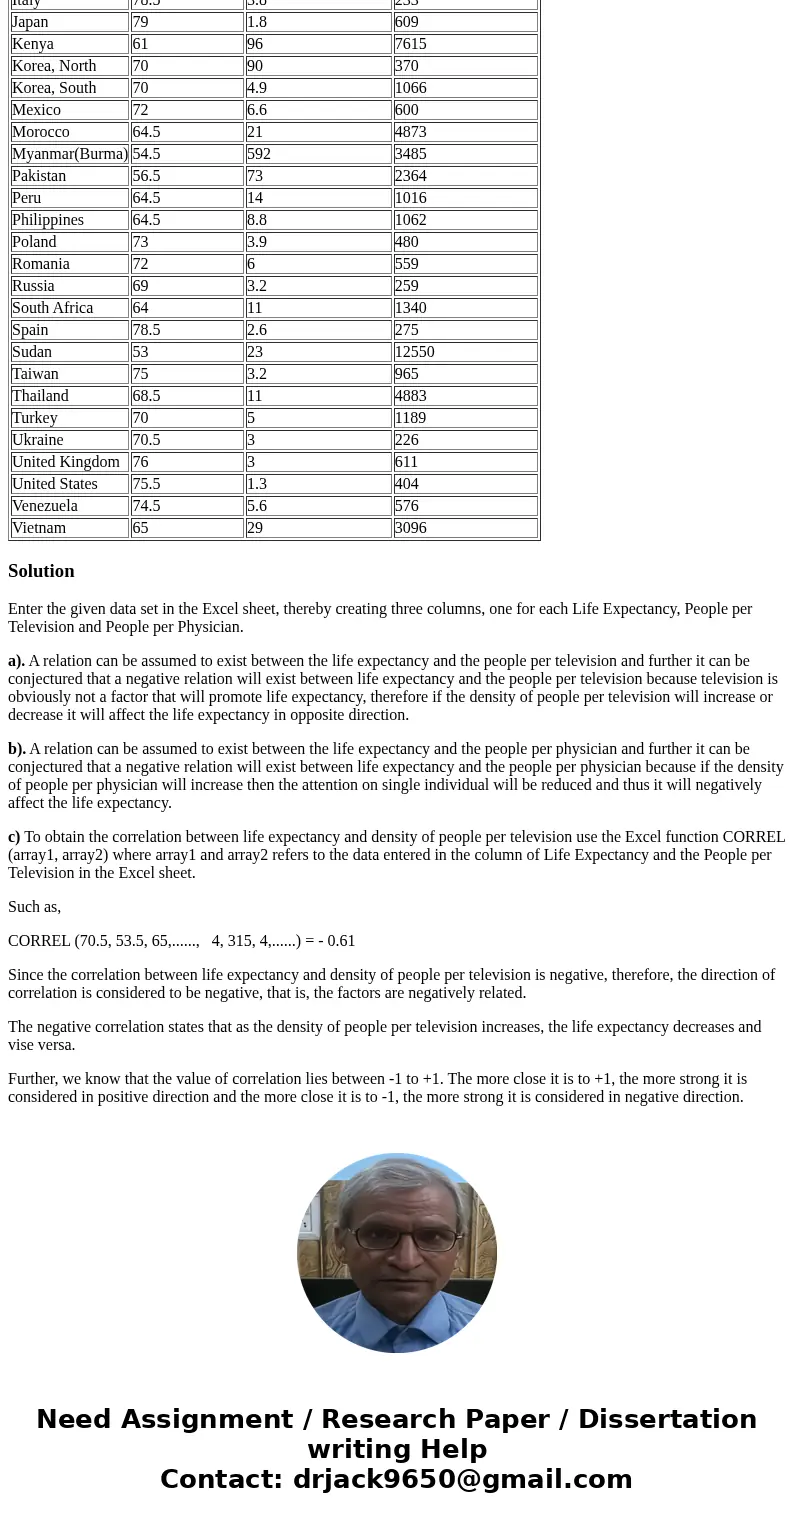
| Japan | 79 | 1.8 | 609 |
| Kenya | 61 | 96 | 7615 |
| Korea, North | 70 | 90 | 370 |
| Korea, South | 70 | 4.9 | 1066 |
| Mexico | 72 | 6.6 | 600 |
| Morocco | 64.5 | 21 | 4873 |
| Myanmar(Burma) | 54.5 | 592 | 3485 |
| Pakistan | 56.5 | 73 | 2364 |
| Peru | 64.5 | 14 | 1016 |
| Philippines | 64.5 | 8.8 | 1062 |
| Poland | 73 | 3.9 | 480 |
| Romania | 72 | 6 | 559 |
| Russia | 69 | 3.2 | 259 |
| South Africa | 64 | 11 | 1340 |
| Spain | 78.5 | 2.6 | 275 |
| Sudan | 53 | 23 | 12550 |
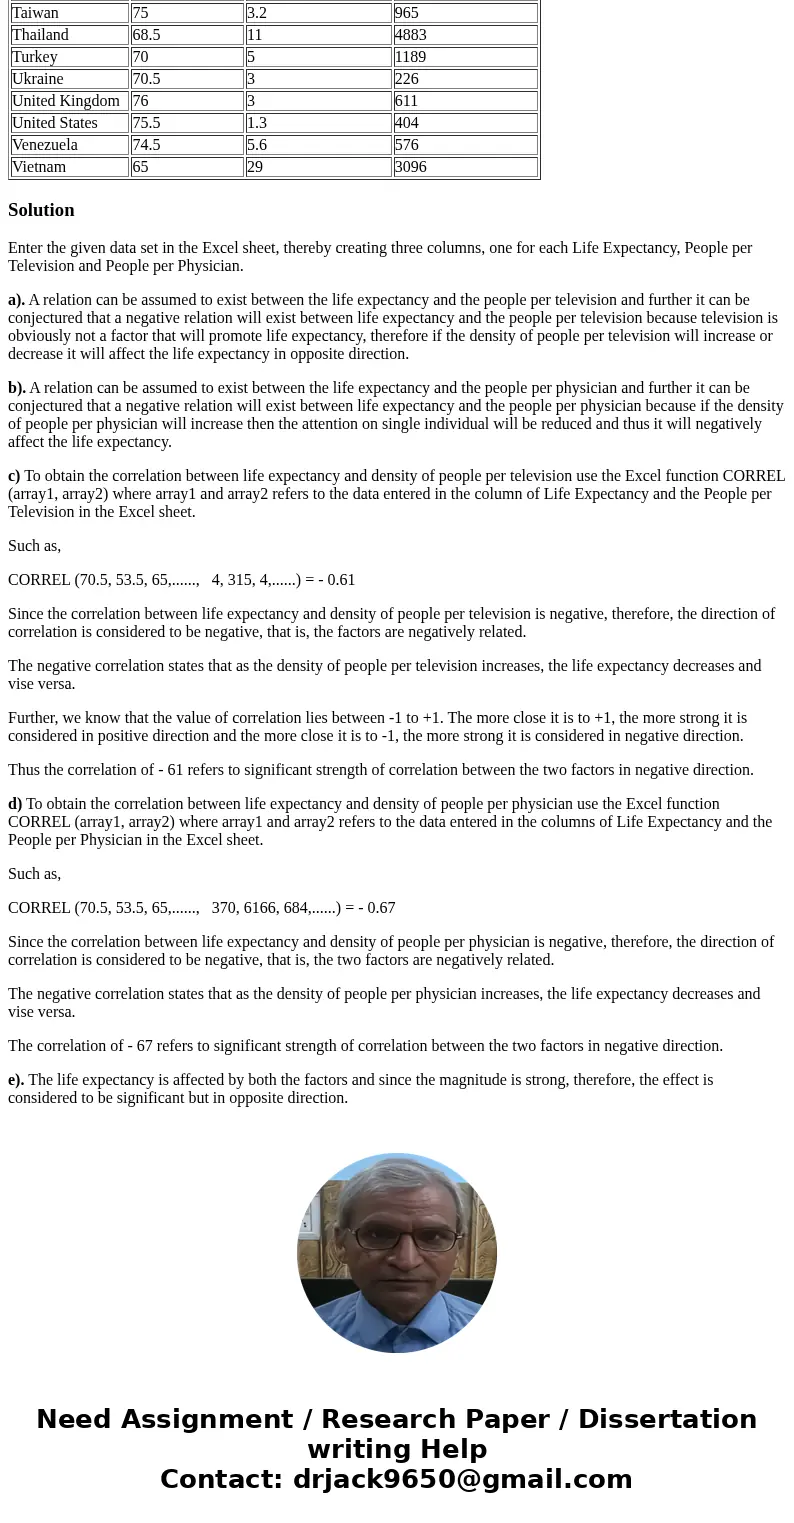
| Taiwan | 75 | 3.2 | 965 |
| Thailand | 68.5 | 11 | 4883 |
| Turkey | 70 | 5 | 1189 |
| Ukraine | 70.5 | 3 | 226 |
| United Kingdom | 76 | 3 | 611 |
| United States | 75.5 | 1.3 | 404 |
| Venezuela | 74.5 | 5.6 | 576 |
| Vietnam | 65 | 29 | 3096 |
Solution
Enter the given data set in the Excel sheet, thereby creating three columns, one for each Life Expectancy, People per Television and People per Physician.
a). A relation can be assumed to exist between the life expectancy and the people per television and further it can be conjectured that a negative relation will exist between life expectancy and the people per television because television is obviously not a factor that will promote life expectancy, therefore if the density of people per television will increase or decrease it will affect the life expectancy in opposite direction.
b). A relation can be assumed to exist between the life expectancy and the people per physician and further it can be conjectured that a negative relation will exist between life expectancy and the people per physician because if the density of people per physician will increase then the attention on single individual will be reduced and thus it will negatively affect the life expectancy.
c) To obtain the correlation between life expectancy and density of people per television use the Excel function CORREL (array1, array2) where array1 and array2 refers to the data entered in the column of Life Expectancy and the People per Television in the Excel sheet.
Such as,
CORREL (70.5, 53.5, 65,......, 4, 315, 4,......) = - 0.61
Since the correlation between life expectancy and density of people per television is negative, therefore, the direction of correlation is considered to be negative, that is, the factors are negatively related.
The negative correlation states that as the density of people per television increases, the life expectancy decreases and vise versa.
Further, we know that the value of correlation lies between -1 to +1. The more close it is to +1, the more strong it is considered in positive direction and the more close it is to -1, the more strong it is considered in negative direction.
Thus the correlation of - 61 refers to significant strength of correlation between the two factors in negative direction.
d) To obtain the correlation between life expectancy and density of people per physician use the Excel function CORREL (array1, array2) where array1 and array2 refers to the data entered in the columns of Life Expectancy and the People per Physician in the Excel sheet.
Such as,
CORREL (70.5, 53.5, 65,......, 370, 6166, 684,......) = - 0.67
Since the correlation between life expectancy and density of people per physician is negative, therefore, the direction of correlation is considered to be negative, that is, the two factors are negatively related.
The negative correlation states that as the density of people per physician increases, the life expectancy decreases and vise versa.
The correlation of - 67 refers to significant strength of correlation between the two factors in negative direction.
e). The life expectancy is affected by both the factors and since the magnitude is strong, therefore, the effect is considered to be significant but in opposite direction.


 Homework Sourse