The data below is from the last 10 refuelings of my car Dete
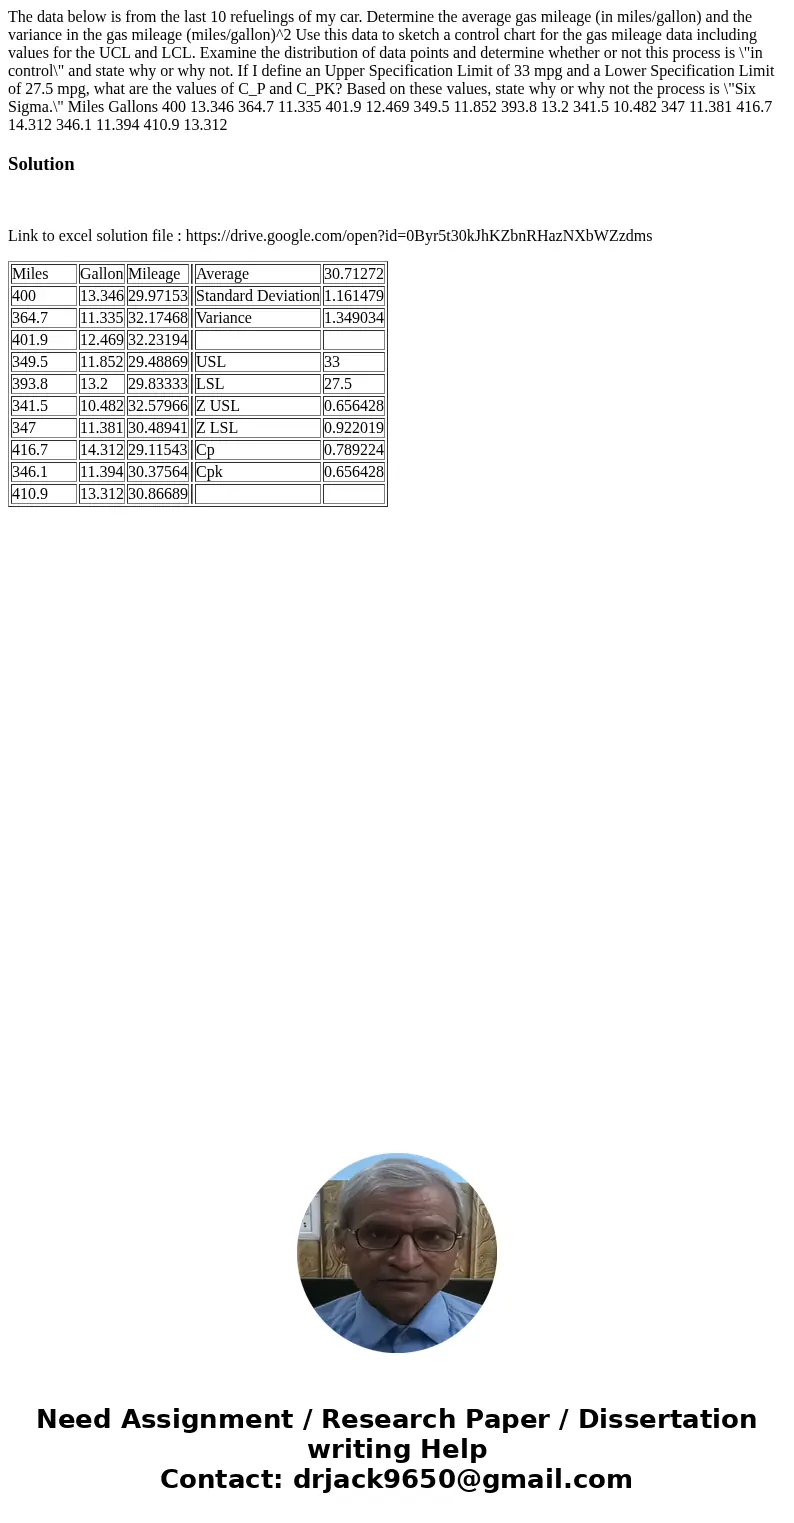
The data below is from the last 10 refuelings of my car. Determine the average gas mileage (in miles/gallon) and the variance in the gas mileage (miles/gallon)^2 Use this data to sketch a control chart for the gas mileage data including values for the UCL and LCL. Examine the distribution of data points and determine whether or not this process is \"in control\" and state why or why not. If I define an Upper Specification Limit of 33 mpg and a Lower Specification Limit of 27.5 mpg, what are the values of C_P and C_PK? Based on these values, state why or why not the process is \"Six Sigma.\" Miles Gallons 400 13.346 364.7 11.335 401.9 12.469 349.5 11.852 393.8 13.2 341.5 10.482 347 11.381 416.7 14.312 346.1 11.394 410.9 13.312

Solution
Link to excel solution file : https://drive.google.com/open?id=0Byr5t30kJhKZbnRHazNXbWZzdms
| Miles | Gallon | Mileage | Average | 30.71272 | |
| 400 | 13.346 | 29.97153 | Standard Deviation | 1.161479 | |
| 364.7 | 11.335 | 32.17468 | Variance | 1.349034 | |
| 401.9 | 12.469 | 32.23194 | |||
| 349.5 | 11.852 | 29.48869 | USL | 33 | |
| 393.8 | 13.2 | 29.83333 | LSL | 27.5 | |
| 341.5 | 10.482 | 32.57966 | Z USL | 0.656428 | |
| 347 | 11.381 | 30.48941 | Z LSL | 0.922019 | |
| 416.7 | 14.312 | 29.11543 | Cp | 0.789224 | |
| 346.1 | 11.394 | 30.37564 | Cpk | 0.656428 | |
| 410.9 | 13.312 | 30.86689 | |

 Homework Sourse