Please help me write a script for a Ttest Using statistical
Please help me write a script for a T-test
Using statistical tests, whether the peaks in the two populations are related to the weather in an (undefined) way. The weather data is NOT on the same time scale as the population data (this data is in quarters or 3 month increments) so we must interpolate this data to match the time scale of the population data.
Here is my script for the interpolated data from the weather.
clc;
clear;
format compact;
M=[1 3 6 9 12 15 18 21 24 27 30 33 36 39 42 45 48];
T=[5 10 20 13 7 12 22 10 10 15 26 20 6 13 25 18 10];
x = 1:1:48;
y = interp1(M,T,x,\'spline\');
plot(M,T,\'o\',x,y),title(\'Temperature vs Month\'),...
xlabel(\'Month\'),ylabel(\'Temperature, degree C\'),
set(gca,\'XMinorTick\',\'on\', \'YMinorTick\',\'on\')
Here is the script that was created from a professional here on Chegg for phase/lag between the two populations.
clc;
clear;
% x is months of population growth and decay
x=1:1:48;
% y1 is the population of mice in 48 months
y1= [300;400;650;900;2000;2300;2250;2200;1800;1600;1200;...
1000;1000;1100;1350;1600;2700;3000;2950;2900;2500;2300;...
1900;1700;1300;1400;1650;1900;3000;3300;3250;3200;2800;2600;...
2200;2000;1600;1300;1100;900;1000;800;700;650;600;575;550;500];
% y2 is the population of foxes in 48 months
y2= [30;33;32;40;42;38;36;33;33;33;31;28;28;28;27;37;35;35;33;32;32;...
29;29;29;27;26;33;39;42;45;47;49;53;52;52;51;51;50;49;50;51;53;52;...
50;49;48;47;46];
[hAx,hLine1,hLine2] = plotyy(x,y1,x,y2);
title(\'Phase/Time Lag Between the Two Populations\')
xlabel(\'Months\')
ylabel(hAx(1),\'Field mice\') % left y-axis
ylabel(hAx(2),\'Foxes\') % right y-axis
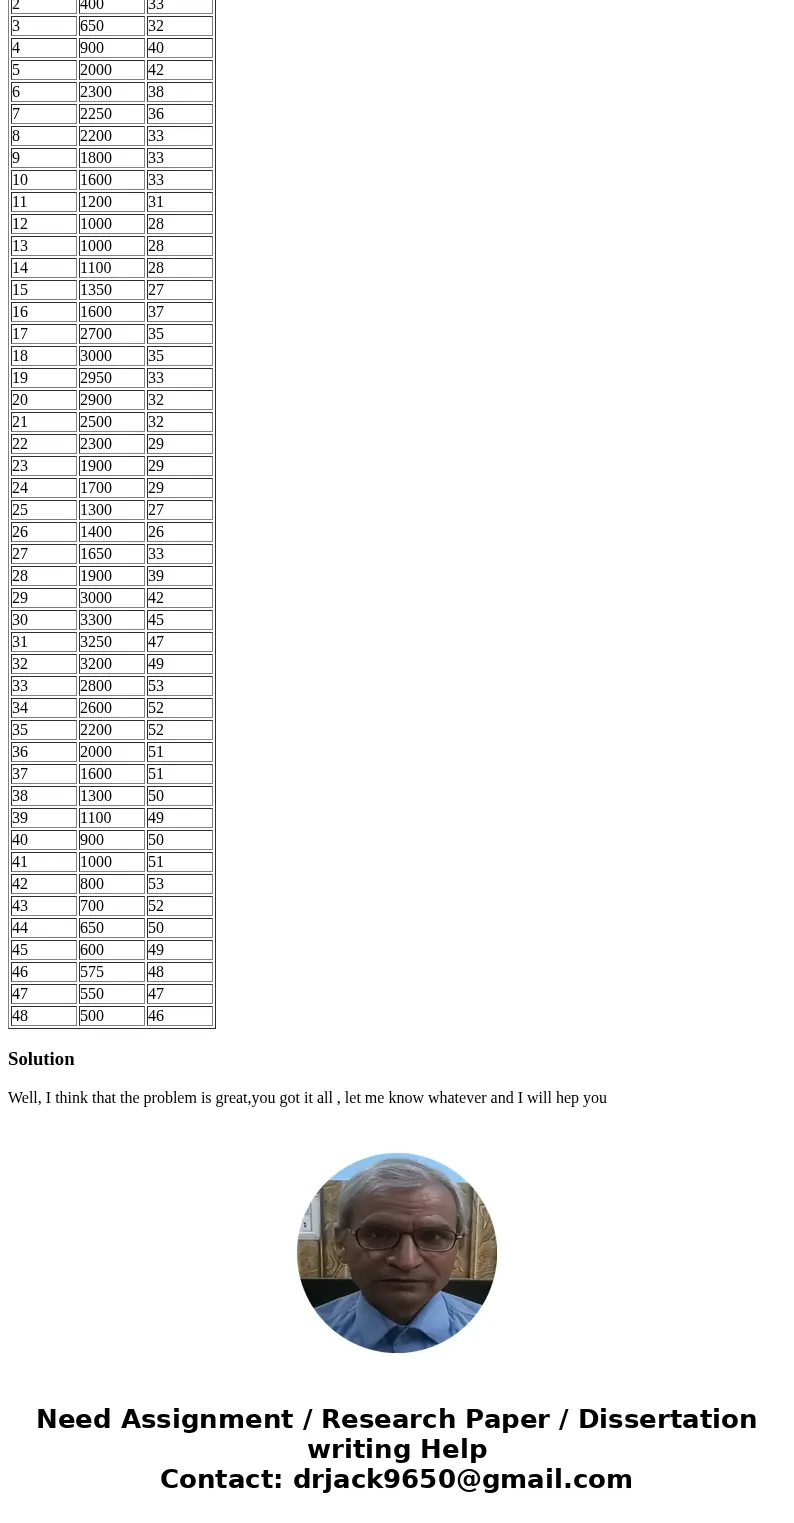
Finally this is the raw data:
Population Data Column A(month), B(Field Mice), C(Foxes)
46
Weather Column 1(month) Column 2( temp 0C)
Thank you for all the help that I have had so far. I have learned so much!
| 1 | 300 | 30 |
| 2 | 400 | 33 |
| 3 | 650 | 32 |
| 4 | 900 | 40 |
| 5 | 2000 | 42 |
| 6 | 2300 | 38 |
| 7 | 2250 | 36 |
| 8 | 2200 | 33 |
| 9 | 1800 | 33 |
| 10 | 1600 | 33 |
| 11 | 1200 | 31 |
| 12 | 1000 | 28 |
| 13 | 1000 | 28 |
| 14 | 1100 | 28 |
| 15 | 1350 | 27 |
| 16 | 1600 | 37 |
| 17 | 2700 | 35 |
| 18 | 3000 | 35 |
| 19 | 2950 | 33 |
| 20 | 2900 | 32 |
| 21 | 2500 | 32 |
| 22 | 2300 | 29 |
| 23 | 1900 | 29 |
| 24 | 1700 | 29 |
| 25 | 1300 | 27 |
| 26 | 1400 | 26 |
| 27 | 1650 | 33 |
| 28 | 1900 | 39 |
| 29 | 3000 | 42 |
| 30 | 3300 | 45 |
| 31 | 3250 | 47 |
| 32 | 3200 | 49 |
| 33 | 2800 | 53 |
| 34 | 2600 | 52 |
| 35 | 2200 | 52 |
| 36 | 2000 | 51 |
| 37 | 1600 | 51 |
| 38 | 1300 | 50 |
| 39 | 1100 | 49 |
| 40 | 900 | 50 |
| 41 | 1000 | 51 |
| 42 | 800 | 53 |
| 43 | 700 | 52 |
| 44 | 650 | 50 |
| 45 | 600 | 49 |
| 46 | 575 | 48 |
| 47 | 550 | 47 |
| 48 | 500 | 46 |
Solution
Well, I think that the problem is great,you got it all , let me know whatever and I will hep you


 Homework Sourse