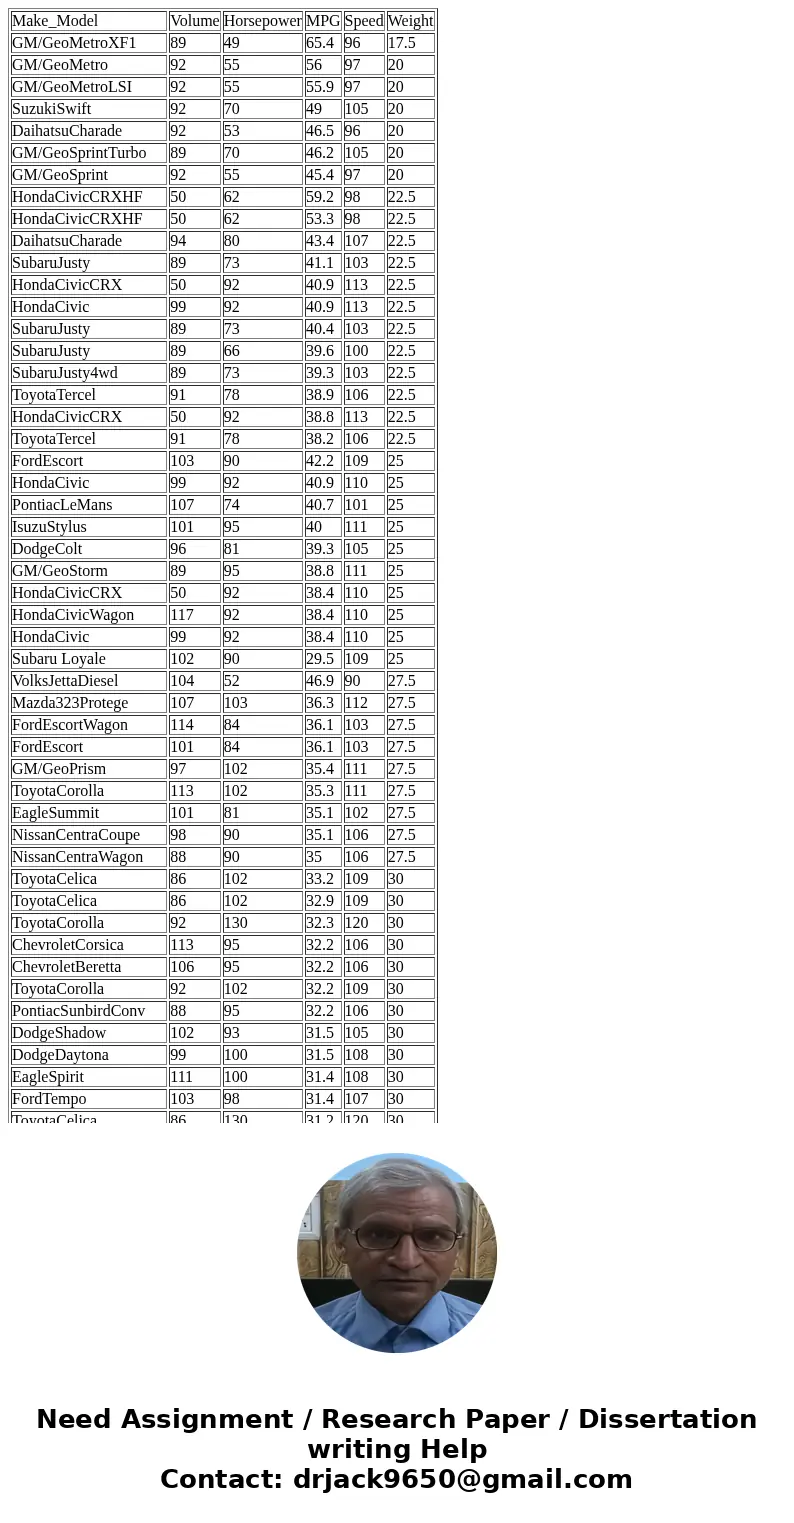
MakeModel Volume Horsepower MPG Speed Weight GMGeoMetroXF1 8
| Make_Model | Volume | Horsepower | MPG | Speed | Weight |
| GM/GeoMetroXF1 | 89 | 49 | 65.4 | 96 | 17.5 |
| GM/GeoMetro | 92 | 55 | 56 | 97 | 20 |
| GM/GeoMetroLSI | 92 | 55 | 55.9 | 97 | 20 |
| SuzukiSwift | 92 | 70 | 49 | 105 | 20 |
| DaihatsuCharade | 92 | 53 | 46.5 | 96 | 20 |
| GM/GeoSprintTurbo | 89 | 70 | 46.2 | 105 | 20 |
| GM/GeoSprint | 92 | 55 | 45.4 | 97 | 20 |
| HondaCivicCRXHF | 50 | 62 | 59.2 | 98 | 22.5 |
| HondaCivicCRXHF | 50 | 62 | 53.3 | 98 | 22.5 |
| DaihatsuCharade | 94 | 80 | 43.4 | 107 | 22.5 |
| SubaruJusty | 89 | 73 | 41.1 | 103 | 22.5 |
| HondaCivicCRX | 50 | 92 | 40.9 | 113 | 22.5 |
| HondaCivic | 99 | 92 | 40.9 | 113 | 22.5 |
| SubaruJusty | 89 | 73 | 40.4 | 103 | 22.5 |
| SubaruJusty | 89 | 66 | 39.6 | 100 | 22.5 |
| SubaruJusty4wd | 89 | 73 | 39.3 | 103 | 22.5 |
| ToyotaTercel | 91 | 78 | 38.9 | 106 | 22.5 |
| HondaCivicCRX | 50 | 92 | 38.8 | 113 | 22.5 |
| ToyotaTercel | 91 | 78 | 38.2 | 106 | 22.5 |
| FordEscort | 103 | 90 | 42.2 | 109 | 25 |
| HondaCivic | 99 | 92 | 40.9 | 110 | 25 |
| PontiacLeMans | 107 | 74 | 40.7 | 101 | 25 |
| IsuzuStylus | 101 | 95 | 40 | 111 | 25 |
| DodgeColt | 96 | 81 | 39.3 | 105 | 25 |
| GM/GeoStorm | 89 | 95 | 38.8 | 111 | 25 |
| HondaCivicCRX | 50 | 92 | 38.4 | 110 | 25 |
| HondaCivicWagon | 117 | 92 | 38.4 | 110 | 25 |
| HondaCivic | 99 | 92 | 38.4 | 110 | 25 |
| Subaru Loyale | 102 | 90 | 29.5 | 109 | 25 |
| VolksJettaDiesel | 104 | 52 | 46.9 | 90 | 27.5 |
| Mazda323Protege | 107 | 103 | 36.3 | 112 | 27.5 |
| FordEscortWagon | 114 | 84 | 36.1 | 103 | 27.5 |
| FordEscort | 101 | 84 | 36.1 | 103 | 27.5 |
| GM/GeoPrism | 97 | 102 | 35.4 | 111 | 27.5 |
| ToyotaCorolla | 113 | 102 | 35.3 | 111 | 27.5 |
| EagleSummit | 101 | 81 | 35.1 | 102 | 27.5 |
| NissanCentraCoupe | 98 | 90 | 35.1 | 106 | 27.5 |
| NissanCentraWagon | 88 | 90 | 35 | 106 | 27.5 |
| ToyotaCelica | 86 | 102 | 33.2 | 109 | 30 |
| ToyotaCelica | 86 | 102 | 32.9 | 109 | 30 |
| ToyotaCorolla | 92 | 130 | 32.3 | 120 | 30 |
| ChevroletCorsica | 113 | 95 | 32.2 | 106 | 30 |
| ChevroletBeretta | 106 | 95 | 32.2 | 106 | 30 |
| ToyotaCorolla | 92 | 102 | 32.2 | 109 | 30 |
| PontiacSunbirdConv | 88 | 95 | 32.2 | 106 | 30 |
| DodgeShadow | 102 | 93 | 31.5 | 105 | 30 |
| DodgeDaytona | 99 | 100 | 31.5 | 108 | 30 |
| EagleSpirit | 111 | 100 | 31.4 | 108 | 30 |
| FordTempo | 103 | 98 | 31.4 | 107 | 30 |
| ToyotaCelica | 86 | 130 | 31.2 | 120 | 30 |
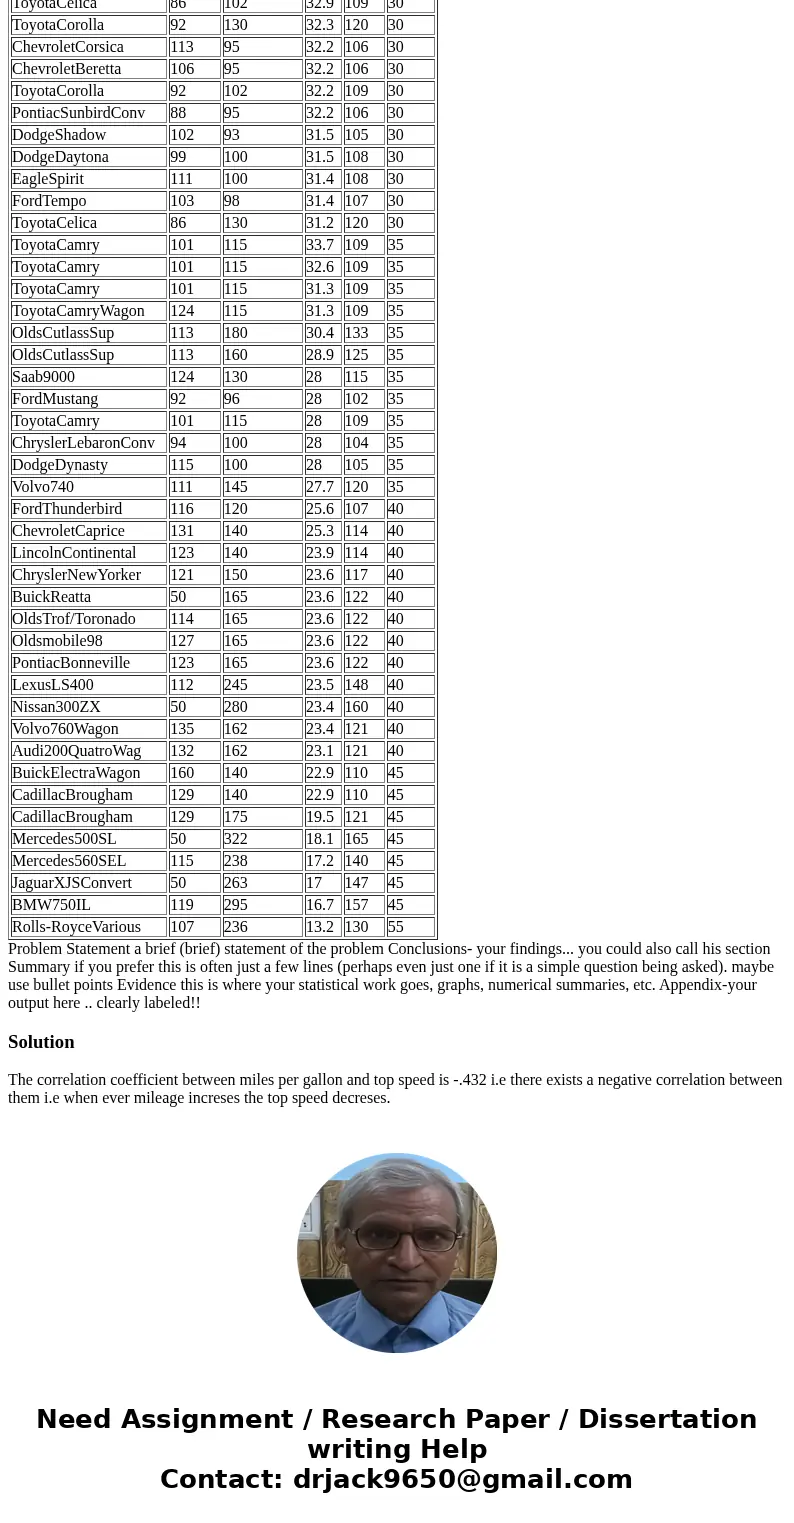
| ToyotaCamry | 101 | 115 | 33.7 | 109 | 35 |
| ToyotaCamry | 101 | 115 | 32.6 | 109 | 35 |
| ToyotaCamry | 101 | 115 | 31.3 | 109 | 35 |
| ToyotaCamryWagon | 124 | 115 | 31.3 | 109 | 35 |
| OldsCutlassSup | 113 | 180 | 30.4 | 133 | 35 |
| OldsCutlassSup | 113 | 160 | 28.9 | 125 | 35 |
| Saab9000 | 124 | 130 | 28 | 115 | 35 |
| FordMustang | 92 | 96 | 28 | 102 | 35 |
| ToyotaCamry | 101 | 115 | 28 | 109 | 35 |
| ChryslerLebaronConv | 94 | 100 | 28 | 104 | 35 |
| DodgeDynasty | 115 | 100 | 28 | 105 | 35 |
| Volvo740 | 111 | 145 | 27.7 | 120 | 35 |
| FordThunderbird | 116 | 120 | 25.6 | 107 | 40 |
| ChevroletCaprice | 131 | 140 | 25.3 | 114 | 40 |
| LincolnContinental | 123 | 140 | 23.9 | 114 | 40 |
| ChryslerNewYorker | 121 | 150 | 23.6 | 117 | 40 |
| BuickReatta | 50 | 165 | 23.6 | 122 | 40 |
| OldsTrof/Toronado | 114 | 165 | 23.6 | 122 | 40 |
| Oldsmobile98 | 127 | 165 | 23.6 | 122 | 40 |
| PontiacBonneville | 123 | 165 | 23.6 | 122 | 40 |
| LexusLS400 | 112 | 245 | 23.5 | 148 | 40 |
| Nissan300ZX | 50 | 280 | 23.4 | 160 | 40 |
| Volvo760Wagon | 135 | 162 | 23.4 | 121 | 40 |
| Audi200QuatroWag | 132 | 162 | 23.1 | 121 | 40 |
| BuickElectraWagon | 160 | 140 | 22.9 | 110 | 45 |
| CadillacBrougham | 129 | 140 | 22.9 | 110 | 45 |
| CadillacBrougham | 129 | 175 | 19.5 | 121 | 45 |
| Mercedes500SL | 50 | 322 | 18.1 | 165 | 45 |
| Mercedes560SEL | 115 | 238 | 17.2 | 140 | 45 |
| JaguarXJSConvert | 50 | 263 | 17 | 147 | 45 |
| BMW750IL | 119 | 295 | 16.7 | 157 | 45 |
| Rolls-RoyceVarious | 107 | 236 | 13.2 | 130 | 55 |
Solution
The correlation coefficient between miles per gallon and top speed is -.432 i.e there exists a negative correlation between them i.e when ever mileage increses the top speed decreses.


 Homework Sourse