Construct a table to compute the KaplanMeier curve for 20 pa
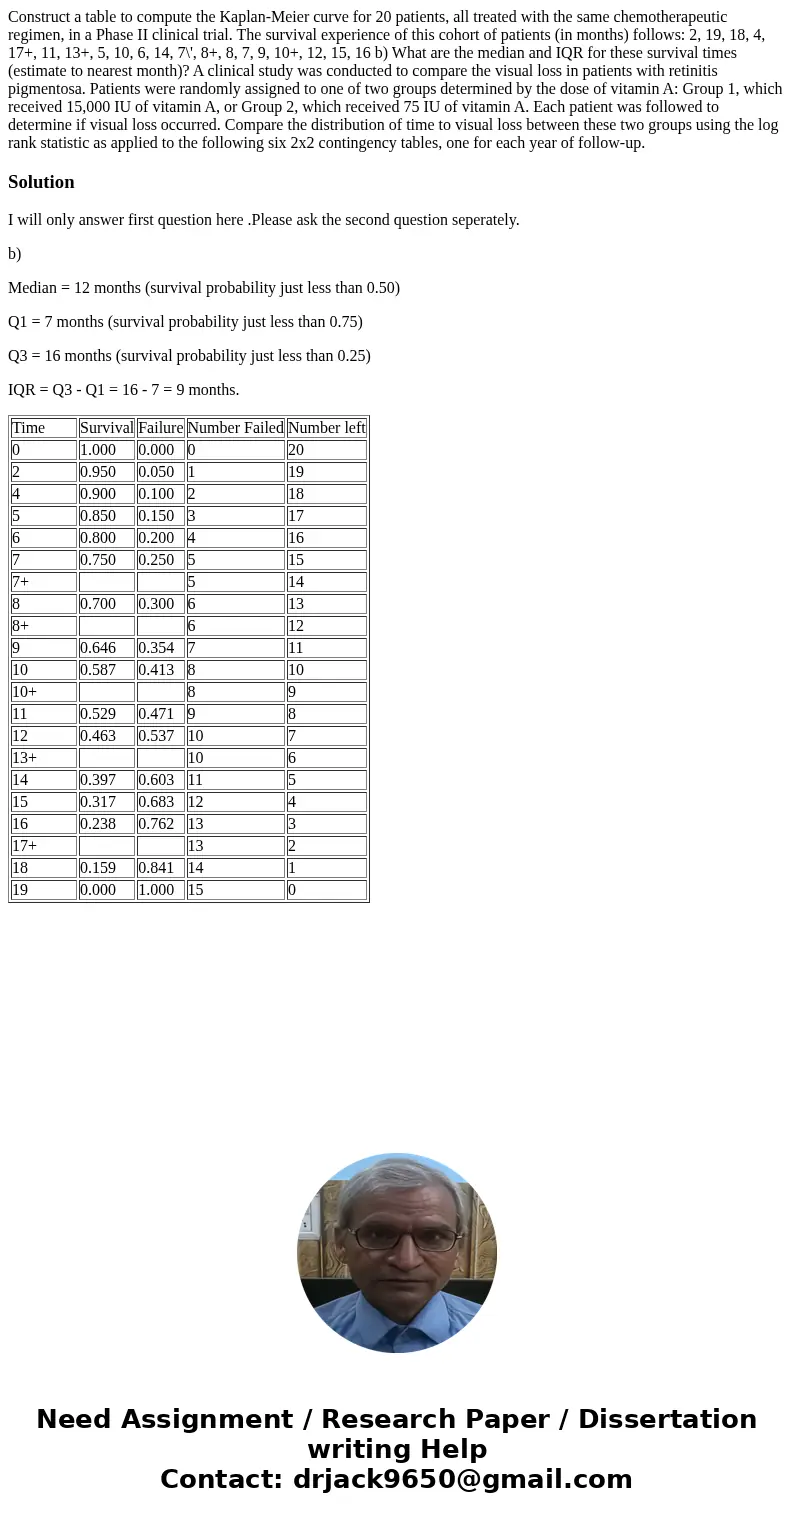
Construct a table to compute the Kaplan-Meier curve for 20 patients, all treated with the same chemotherapeutic regimen, in a Phase II clinical trial. The survival experience of this cohort of patients (in months) follows: 2, 19, 18, 4, 17+, 11, 13+, 5, 10, 6, 14, 7\', 8+, 8, 7, 9, 10+, 12, 15, 16 b) What are the median and IQR for these survival times (estimate to nearest month)? A clinical study was conducted to compare the visual loss in patients with retinitis pigmentosa. Patients were randomly assigned to one of two groups determined by the dose of vitamin A: Group 1, which received 15,000 IU of vitamin A, or Group 2, which received 75 IU of vitamin A. Each patient was followed to determine if visual loss occurred. Compare the distribution of time to visual loss between these two groups using the log rank statistic as applied to the following six 2x2 contingency tables, one for each year of follow-up.

Solution
I will only answer first question here .Please ask the second question seperately.
b)
Median = 12 months (survival probability just less than 0.50)
Q1 = 7 months (survival probability just less than 0.75)
Q3 = 16 months (survival probability just less than 0.25)
IQR = Q3 - Q1 = 16 - 7 = 9 months.
| Time | Survival | Failure | Number Failed | Number left |
| 0 | 1.000 | 0.000 | 0 | 20 |
| 2 | 0.950 | 0.050 | 1 | 19 |
| 4 | 0.900 | 0.100 | 2 | 18 |
| 5 | 0.850 | 0.150 | 3 | 17 |
| 6 | 0.800 | 0.200 | 4 | 16 |
| 7 | 0.750 | 0.250 | 5 | 15 |
| 7+ | 5 | 14 | ||
| 8 | 0.700 | 0.300 | 6 | 13 |
| 8+ | 6 | 12 | ||
| 9 | 0.646 | 0.354 | 7 | 11 |
| 10 | 0.587 | 0.413 | 8 | 10 |
| 10+ | 8 | 9 | ||
| 11 | 0.529 | 0.471 | 9 | 8 |
| 12 | 0.463 | 0.537 | 10 | 7 |
| 13+ | 10 | 6 | ||
| 14 | 0.397 | 0.603 | 11 | 5 |
| 15 | 0.317 | 0.683 | 12 | 4 |
| 16 | 0.238 | 0.762 | 13 | 3 |
| 17+ | 13 | 2 | ||
| 18 | 0.159 | 0.841 | 14 | 1 |
| 19 | 0.000 | 1.000 | 15 | 0 |

 Homework Sourse