clc close all clear all fs1002000 ts1fs t01ts01ts Nolengtht
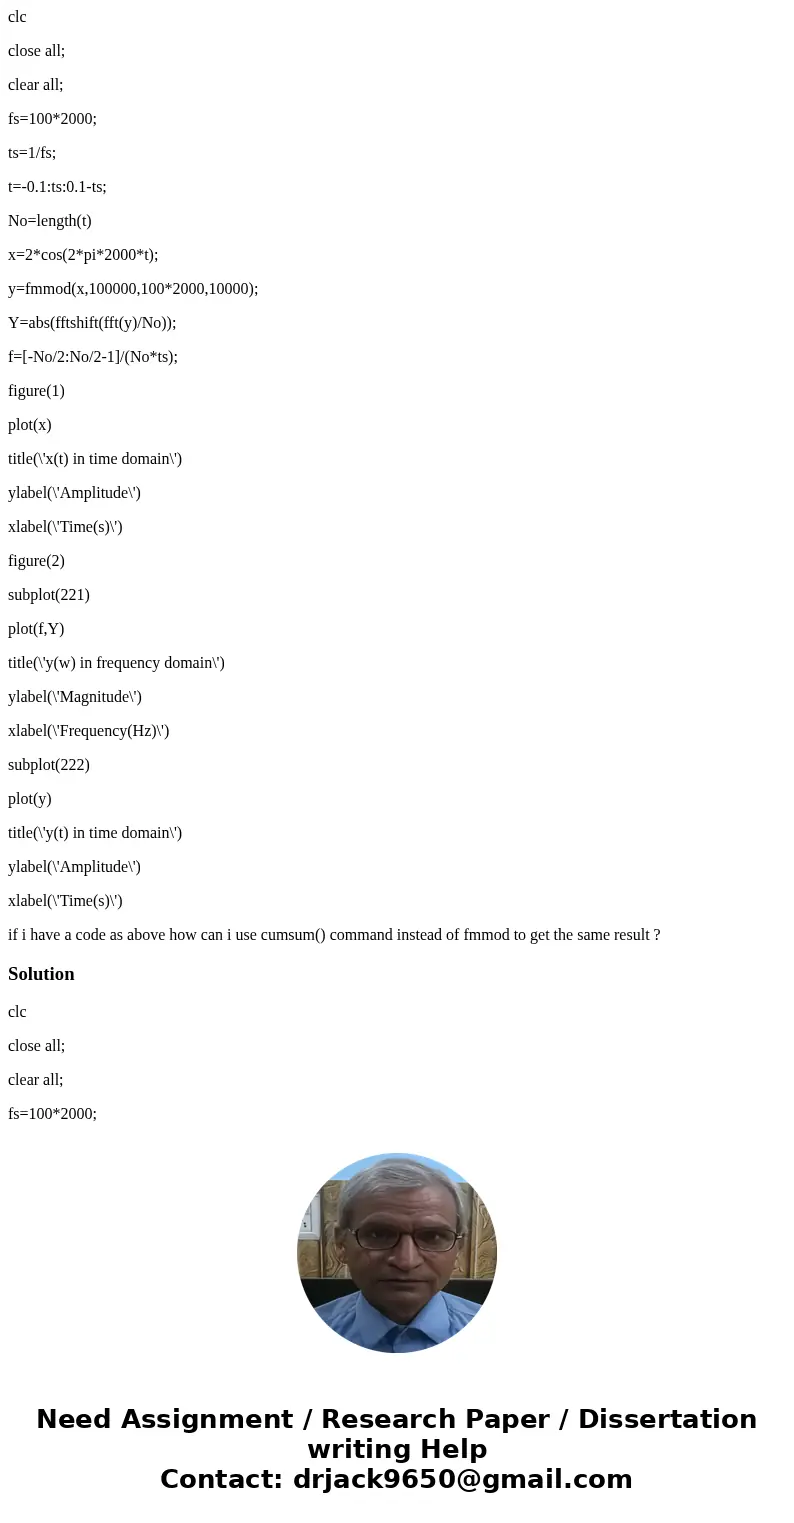
clc
close all;
clear all;
fs=100*2000;
ts=1/fs;
t=-0.1:ts:0.1-ts;
No=length(t)
x=2*cos(2*pi*2000*t);
y=fmmod(x,100000,100*2000,10000);
Y=abs(fftshift(fft(y)/No));
f=[-No/2:No/2-1]/(No*ts);
figure(1)
plot(x)
title(\'x(t) in time domain\')
ylabel(\'Amplitude\')
xlabel(\'Time(s)\')
figure(2)
subplot(221)
plot(f,Y)
title(\'y(w) in frequency domain\')
ylabel(\'Magnitude\')
xlabel(\'Frequency(Hz)\')
subplot(222)
plot(y)
title(\'y(t) in time domain\')
ylabel(\'Amplitude\')
xlabel(\'Time(s)\')
if i have a code as above how can i use cumsum() command instead of fmmod to get the same result ?
Solution
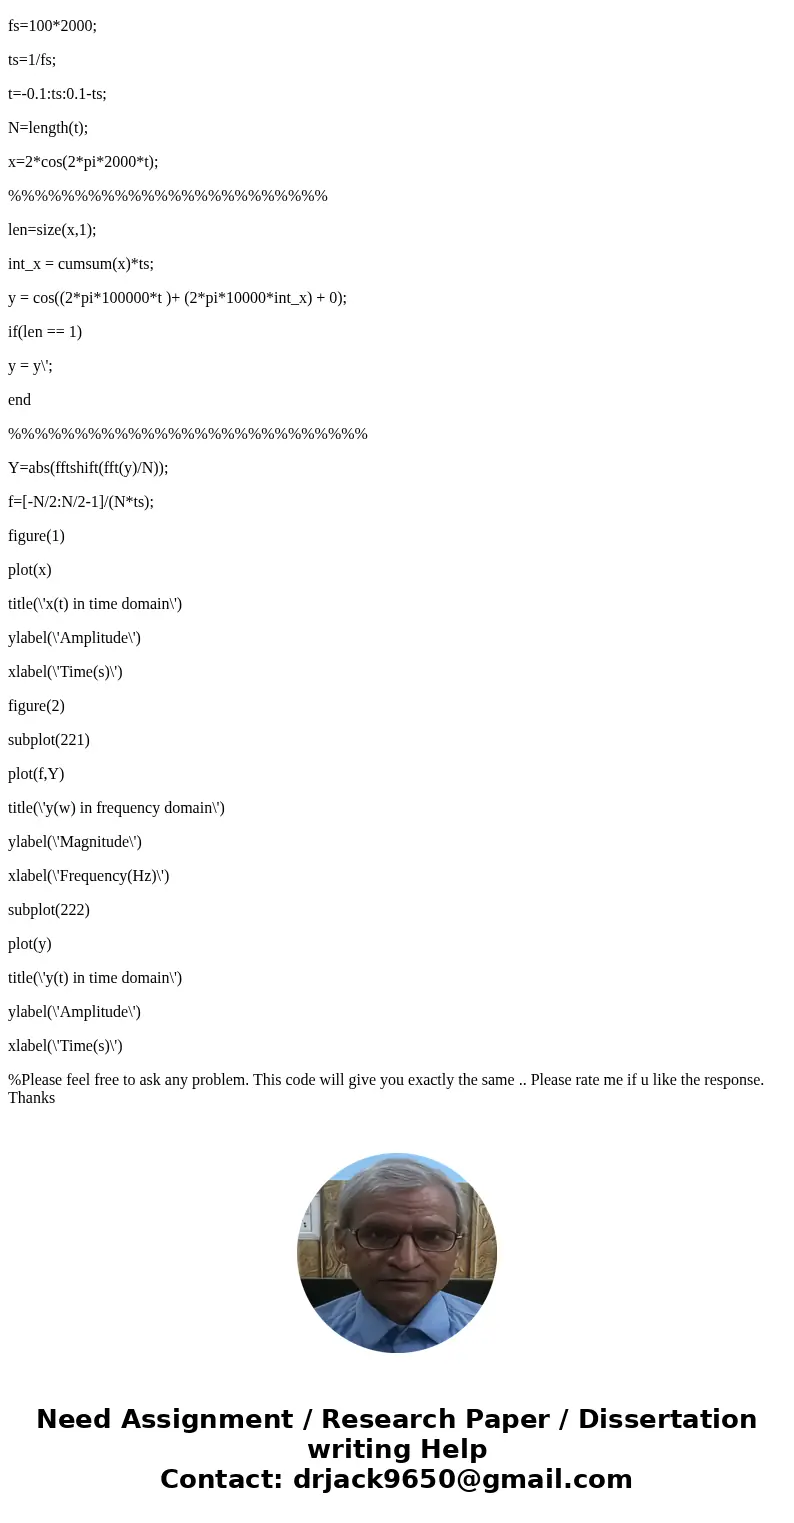
clc
close all;
clear all;
fs=100*2000;
ts=1/fs;
t=-0.1:ts:0.1-ts;
N=length(t);
x=2*cos(2*pi*2000*t);
%%%%%%%%%%%%%%%%%%%%%%%%
len=size(x,1);
int_x = cumsum(x)*ts;
y = cos((2*pi*100000*t )+ (2*pi*10000*int_x) + 0);
if(len == 1)
y = y\';
end
%%%%%%%%%%%%%%%%%%%%%%%%%%%
Y=abs(fftshift(fft(y)/N));
f=[-N/2:N/2-1]/(N*ts);
figure(1)
plot(x)
title(\'x(t) in time domain\')
ylabel(\'Amplitude\')
xlabel(\'Time(s)\')
figure(2)
subplot(221)
plot(f,Y)
title(\'y(w) in frequency domain\')
ylabel(\'Magnitude\')
xlabel(\'Frequency(Hz)\')
subplot(222)
plot(y)
title(\'y(t) in time domain\')
ylabel(\'Amplitude\')
xlabel(\'Time(s)\')
%Please feel free to ask any problem. This code will give you exactly the same .. Please rate me if u like the response. Thanks


 Homework Sourse