an article in a medical journal presents data relating ulna
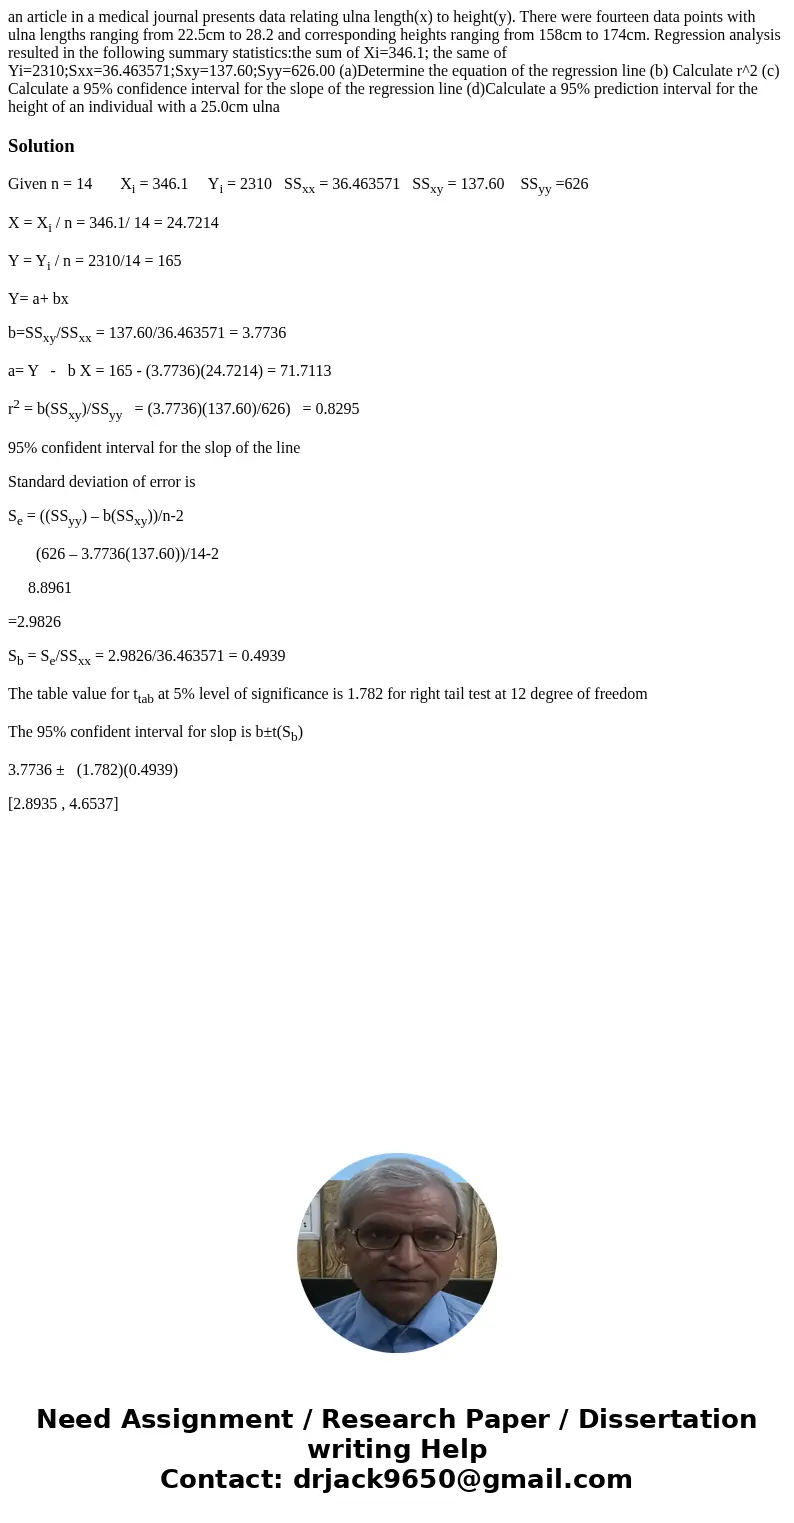
an article in a medical journal presents data relating ulna length(x) to height(y). There were fourteen data points with ulna lengths ranging from 22.5cm to 28.2 and corresponding heights ranging from 158cm to 174cm. Regression analysis resulted in the following summary statistics:the sum of Xi=346.1; the same of Yi=2310;Sxx=36.463571;Sxy=137.60;Syy=626.00 (a)Determine the equation of the regression line (b) Calculate r^2 (c) Calculate a 95% confidence interval for the slope of the regression line (d)Calculate a 95% prediction interval for the height of an individual with a 25.0cm ulna
Solution
Given n = 14 Xi = 346.1 Yi = 2310 SSxx = 36.463571 SSxy = 137.60 SSyy =626
X = Xi / n = 346.1/ 14 = 24.7214
Y = Yi / n = 2310/14 = 165
Y= a+ bx
b=SSxy/SSxx = 137.60/36.463571 = 3.7736
a= Y - b X = 165 - (3.7736)(24.7214) = 71.7113
r2 = b(SSxy)/SSyy = (3.7736)(137.60)/626) = 0.8295
95% confident interval for the slop of the line
Standard deviation of error is
Se = ((SSyy) – b(SSxy))/n-2
(626 – 3.7736(137.60))/14-2
8.8961
=2.9826
Sb = Se/SSxx = 2.9826/36.463571 = 0.4939
The table value for ttab at 5% level of significance is 1.782 for right tail test at 12 degree of freedom
The 95% confident interval for slop is b±t(Sb)
3.7736 ± (1.782)(0.4939)
[2.8935 , 4.6537]

 Homework Sourse