Use the high closing values of Naristar Inc stock from the y
Use the high closing values of Naristar Inc. stock from the years 1992 - 2003 to construct a time-series graph. (Let x = 0 represent 1992 and so on.) Identify a trend.
Year 1992 High 48
Year 1993 High 53
Year 1994 High 47
Year 1995 High 55
Year 1996 High 58
Year 1997 High 61
Year 1998 High 62
Year 1999 High 60
Year 2000 High 68
Year 2001 High 42
Year 2002 High 51
Year 2003 High 78
Solution
We have to construct a time series graph and identify the trend.
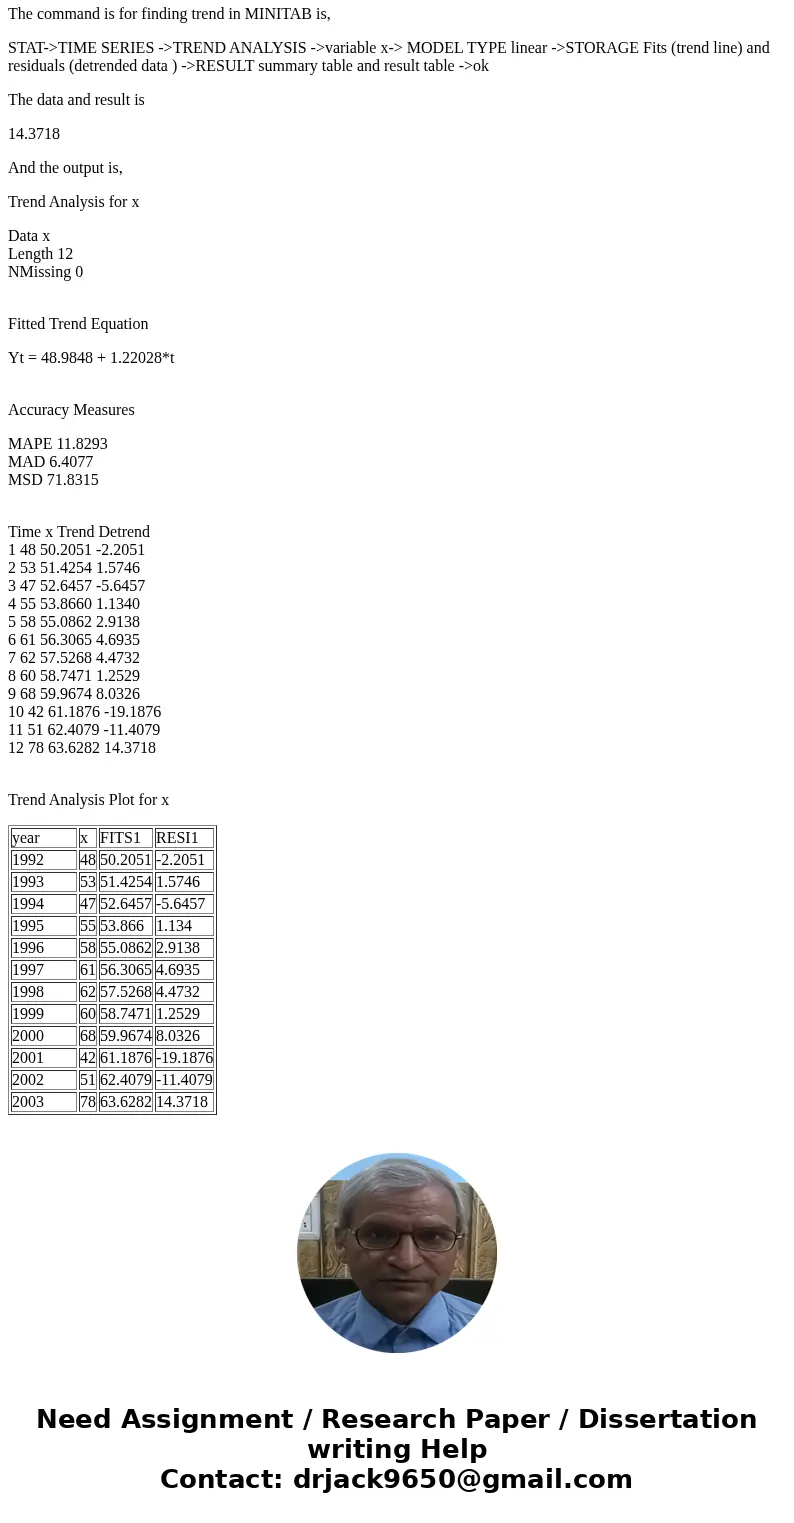
By using MINITAB we get a following output.
The command is for finding trend in MINITAB is,
STAT->TIME SERIES ->TREND ANALYSIS ->variable x-> MODEL TYPE linear ->STORAGE Fits (trend line) and residuals (detrended data ) ->RESULT summary table and result table ->ok
The data and result is
14.3718
And the output is,
Trend Analysis for x
Data x
Length 12
NMissing 0
Fitted Trend Equation
Yt = 48.9848 + 1.22028*t
Accuracy Measures
MAPE 11.8293
MAD 6.4077
MSD 71.8315
Time x Trend Detrend
1 48 50.2051 -2.2051
2 53 51.4254 1.5746
3 47 52.6457 -5.6457
4 55 53.8660 1.1340
5 58 55.0862 2.9138
6 61 56.3065 4.6935
7 62 57.5268 4.4732
8 60 58.7471 1.2529
9 68 59.9674 8.0326
10 42 61.1876 -19.1876
11 51 62.4079 -11.4079
12 78 63.6282 14.3718
Trend Analysis Plot for x
| year | x | FITS1 | RESI1 |
| 1992 | 48 | 50.2051 | -2.2051 |
| 1993 | 53 | 51.4254 | 1.5746 |
| 1994 | 47 | 52.6457 | -5.6457 |
| 1995 | 55 | 53.866 | 1.134 |
| 1996 | 58 | 55.0862 | 2.9138 |
| 1997 | 61 | 56.3065 | 4.6935 |
| 1998 | 62 | 57.5268 | 4.4732 |
| 1999 | 60 | 58.7471 | 1.2529 |
| 2000 | 68 | 59.9674 | 8.0326 |
| 2001 | 42 | 61.1876 | -19.1876 |
| 2002 | 51 | 62.4079 | -11.4079 |
| 2003 | 78 | 63.6282 | 14.3718 |


 Homework Sourse