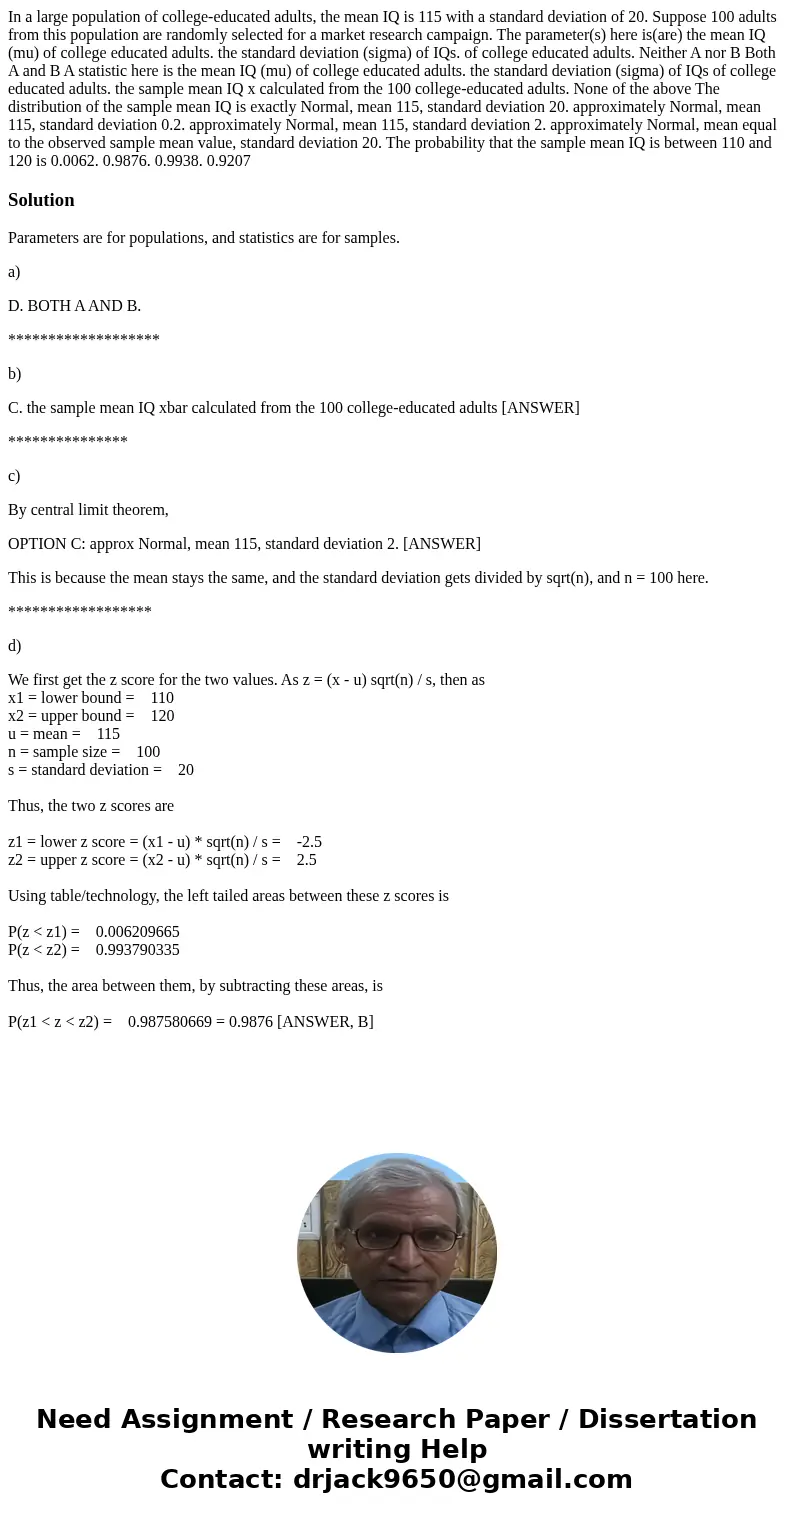
In a large population of collegeeducated adults the mean IQ
Solution
Parameters are for populations, and statistics are for samples.
a)
D. BOTH A AND B.
*******************
b)
C. the sample mean IQ xbar calculated from the 100 college-educated adults [ANSWER]
***************
c)
By central limit theorem,
OPTION C: approx Normal, mean 115, standard deviation 2. [ANSWER]
This is because the mean stays the same, and the standard deviation gets divided by sqrt(n), and n = 100 here.
******************
d)
We first get the z score for the two values. As z = (x - u) sqrt(n) / s, then as
x1 = lower bound = 110
x2 = upper bound = 120
u = mean = 115
n = sample size = 100
s = standard deviation = 20
Thus, the two z scores are
z1 = lower z score = (x1 - u) * sqrt(n) / s = -2.5
z2 = upper z score = (x2 - u) * sqrt(n) / s = 2.5
Using table/technology, the left tailed areas between these z scores is
P(z < z1) = 0.006209665
P(z < z2) = 0.993790335
Thus, the area between them, by subtracting these areas, is
P(z1 < z < z2) = 0.987580669 = 0.9876 [ANSWER, B]

 Homework Sourse