The staff of a grocery products manufacturer is developing a
The staff of a grocery products manufacturer is developing a model for the production and distribution of its cereal products. The model requires transportation costs for a very large number of origins and destinations. It is impractical to do the detailed tariff analysis for every possible combination, so a random sample of 50 routes is selected. For each route, the mileage and the shipping rate (in dollars per 100 pounds) are found.
Use SPSS when approrpriate.
1. Find the equation of a straight line that describes how shipping rate varies with mileage
2. Test the null hypothesis that shipping rate is unaffected by mileage. State your conclusion.
3. What is the effect of each additional mile on the shipping rate? Give a 95% confidence interval estimate.
| Mileage | Rate |
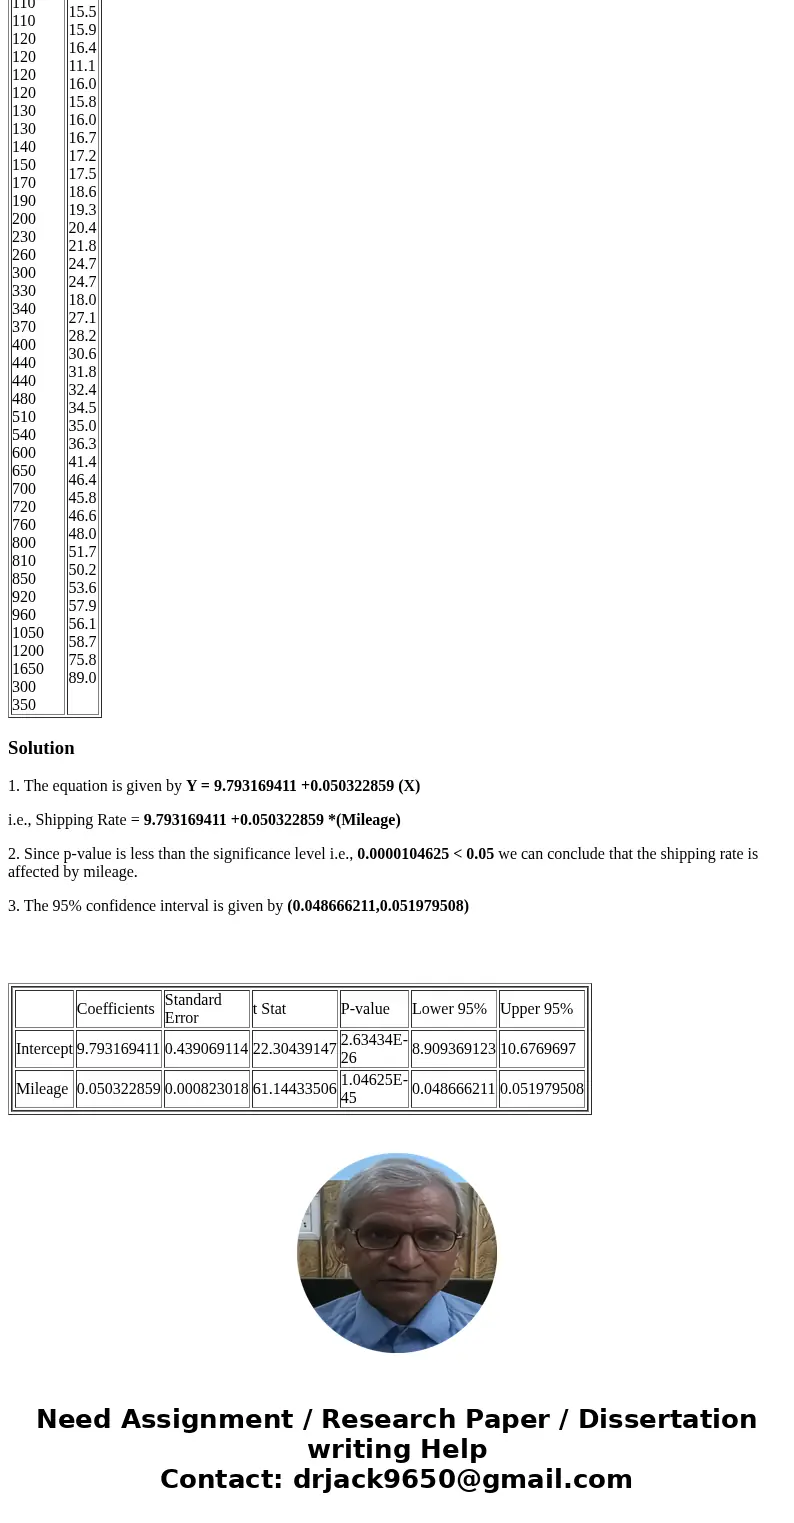
| 50 60 80 80 90 90 100 100 100 110 110 110 120 120 120 120 130 130 140 150 170 190 200 230 260 300 330 340 370 400 440 440 480 510 540 600 650 700 720 760 800 810 850 920 960 1050 1200 1650 300 350 | 12.7 13.0 13.7 14.1 14.6 14.1 15.6 14.9 14.5 15.3 15.5 15.9 16.4 11.1 16.0 15.8 16.0 16.7 17.2 17.5 18.6 19.3 20.4 21.8 24.7 24.7 18.0 27.1 28.2 30.6 31.8 32.4 34.5 35.0 36.3 41.4 46.4 45.8 46.6 48.0 51.7 50.2 53.6 57.9 56.1 58.7 75.8 89.0 |
Solution
1. The equation is given by Y = 9.793169411 +0.050322859 (X)
i.e., Shipping Rate = 9.793169411 +0.050322859 *(Mileage)
2. Since p-value is less than the significance level i.e., 0.0000104625 < 0.05 we can conclude that the shipping rate is affected by mileage.
3. The 95% confidence interval is given by (0.048666211,0.051979508)
|


 Homework Sourse