1 Refer to the baseball data in the resources folder Conside
1. Refer to the baseball data in the resources folder. Consider the following variables:
1. Number of wins
2. Payroll
3. Season attendance
4. Whether the team is in the American or National League
5. The number of home runs hit
A.) Which of these variables are quantitative and which are qualitative?
B.) Determine the level of measurement (nominal, ordinal, interval, or ratio) for each of the variables.
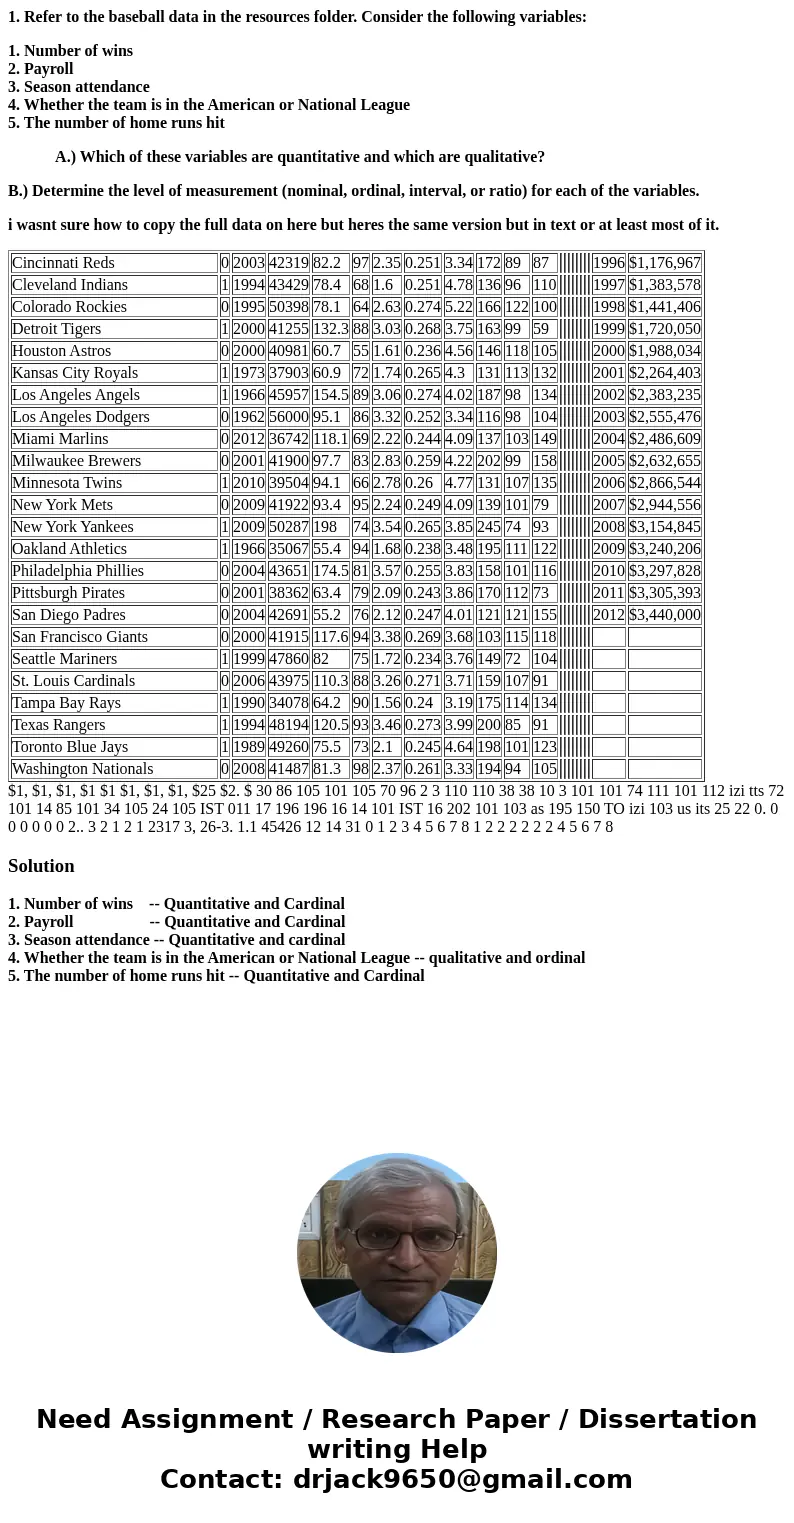
i wasnt sure how to copy the full data on here but heres the same version but in text or at least most of it.
| Cincinnati Reds | 0 | 2003 | 42319 | 82.2 | 97 | 2.35 | 0.251 | 3.34 | 172 | 89 | 87 | 1996 | $1,176,967 | ||||||||
| Cleveland Indians | 1 | 1994 | 43429 | 78.4 | 68 | 1.6 | 0.251 | 4.78 | 136 | 96 | 110 | 1997 | $1,383,578 | ||||||||
| Colorado Rockies | 0 | 1995 | 50398 | 78.1 | 64 | 2.63 | 0.274 | 5.22 | 166 | 122 | 100 | 1998 | $1,441,406 | ||||||||
| Detroit Tigers | 1 | 2000 | 41255 | 132.3 | 88 | 3.03 | 0.268 | 3.75 | 163 | 99 | 59 | 1999 | $1,720,050 | ||||||||
| Houston Astros | 0 | 2000 | 40981 | 60.7 | 55 | 1.61 | 0.236 | 4.56 | 146 | 118 | 105 | 2000 | $1,988,034 | ||||||||
| Kansas City Royals | 1 | 1973 | 37903 | 60.9 | 72 | 1.74 | 0.265 | 4.3 | 131 | 113 | 132 | 2001 | $2,264,403 | ||||||||
| Los Angeles Angels | 1 | 1966 | 45957 | 154.5 | 89 | 3.06 | 0.274 | 4.02 | 187 | 98 | 134 | 2002 | $2,383,235 | ||||||||
| Los Angeles Dodgers | 0 | 1962 | 56000 | 95.1 | 86 | 3.32 | 0.252 | 3.34 | 116 | 98 | 104 | 2003 | $2,555,476 | ||||||||
| Miami Marlins | 0 | 2012 | 36742 | 118.1 | 69 | 2.22 | 0.244 | 4.09 | 137 | 103 | 149 | 2004 | $2,486,609 | ||||||||
| Milwaukee Brewers | 0 | 2001 | 41900 | 97.7 | 83 | 2.83 | 0.259 | 4.22 | 202 | 99 | 158 | 2005 | $2,632,655 | ||||||||
| Minnesota Twins | 1 | 2010 | 39504 | 94.1 | 66 | 2.78 | 0.26 | 4.77 | 131 | 107 | 135 | 2006 | $2,866,544 | ||||||||
| New York Mets | 0 | 2009 | 41922 | 93.4 | 95 | 2.24 | 0.249 | 4.09 | 139 | 101 | 79 | 2007 | $2,944,556 | ||||||||
| New York Yankees | 1 | 2009 | 50287 | 198 | 74 | 3.54 | 0.265 | 3.85 | 245 | 74 | 93 | 2008 | $3,154,845 | ||||||||
| Oakland Athletics | 1 | 1966 | 35067 | 55.4 | 94 | 1.68 | 0.238 | 3.48 | 195 | 111 | 122 | 2009 | $3,240,206 | ||||||||
| Philadelphia Phillies | 0 | 2004 | 43651 | 174.5 | 81 | 3.57 | 0.255 | 3.83 | 158 | 101 | 116 | 2010 | $3,297,828 | ||||||||
| Pittsburgh Pirates | 0 | 2001 | 38362 | 63.4 | 79 | 2.09 | 0.243 | 3.86 | 170 | 112 | 73 | 2011 | $3,305,393 | ||||||||
| San Diego Padres | 0 | 2004 | 42691 | 55.2 | 76 | 2.12 | 0.247 | 4.01 | 121 | 121 | 155 | 2012 | $3,440,000 | ||||||||
| San Francisco Giants | 0 | 2000 | 41915 | 117.6 | 94 | 3.38 | 0.269 | 3.68 | 103 | 115 | 118 | ||||||||||
| Seattle Mariners | 1 | 1999 | 47860 | 82 | 75 | 1.72 | 0.234 | 3.76 | 149 | 72 | 104 | ||||||||||
| St. Louis Cardinals | 0 | 2006 | 43975 | 110.3 | 88 | 3.26 | 0.271 | 3.71 | 159 | 107 | 91 | ||||||||||
| Tampa Bay Rays | 1 | 1990 | 34078 | 64.2 | 90 | 1.56 | 0.24 | 3.19 | 175 | 114 | 134 | ||||||||||
| Texas Rangers | 1 | 1994 | 48194 | 120.5 | 93 | 3.46 | 0.273 | 3.99 | 200 | 85 | 91 | ||||||||||
| Toronto Blue Jays | 1 | 1989 | 49260 | 75.5 | 73 | 2.1 | 0.245 | 4.64 | 198 | 101 | 123 | ||||||||||
| Washington Nationals | 0 | 2008 | 41487 | 81.3 | 98 | 2.37 | 0.261 | 3.33 | 194 | 94 | 105 |
Solution
1. Number of wins -- Quantitative and Cardinal
2. Payroll -- Quantitative and Cardinal
3. Season attendance -- Quantitative and cardinal
4. Whether the team is in the American or National League -- qualitative and ordinal
5. The number of home runs hit -- Quantitative and Cardinal

 Homework Sourse