Complete the following table using the data set below Coeffi
Complete the following table using the data set below.
| Coefficients | Standard Error | t Stat | P-Value | |
| Intercept | ? | ? | ? | ? |
| L | ? | ? | ? | ? |
| K | ? | ? | ? | ? |
| T | ? | ? | ? | ? |
Solution
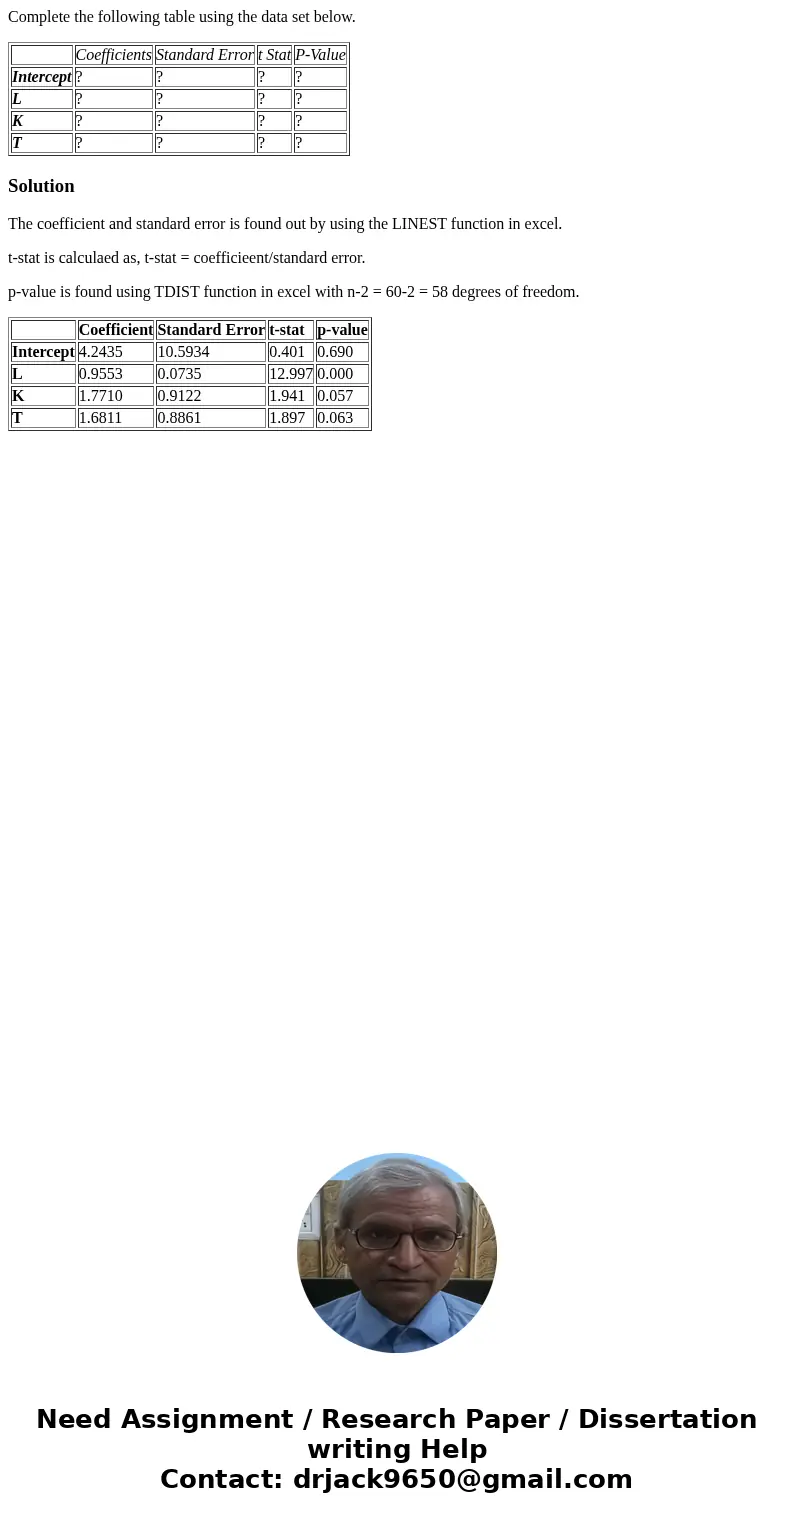
The coefficient and standard error is found out by using the LINEST function in excel.
t-stat is calculaed as, t-stat = coefficieent/standard error.
p-value is found using TDIST function in excel with n-2 = 60-2 = 58 degrees of freedom.
| Coefficient | Standard Error | t-stat | p-value | |
| Intercept | 4.2435 | 10.5934 | 0.401 | 0.690 |
| L | 0.9553 | 0.0735 | 12.997 | 0.000 |
| K | 1.7710 | 0.9122 | 1.941 | 0.057 |
| T | 1.6811 | 0.8861 | 1.897 | 0.063 |

 Homework Sourse