TCO E The Central Company manufactures a certain item once a
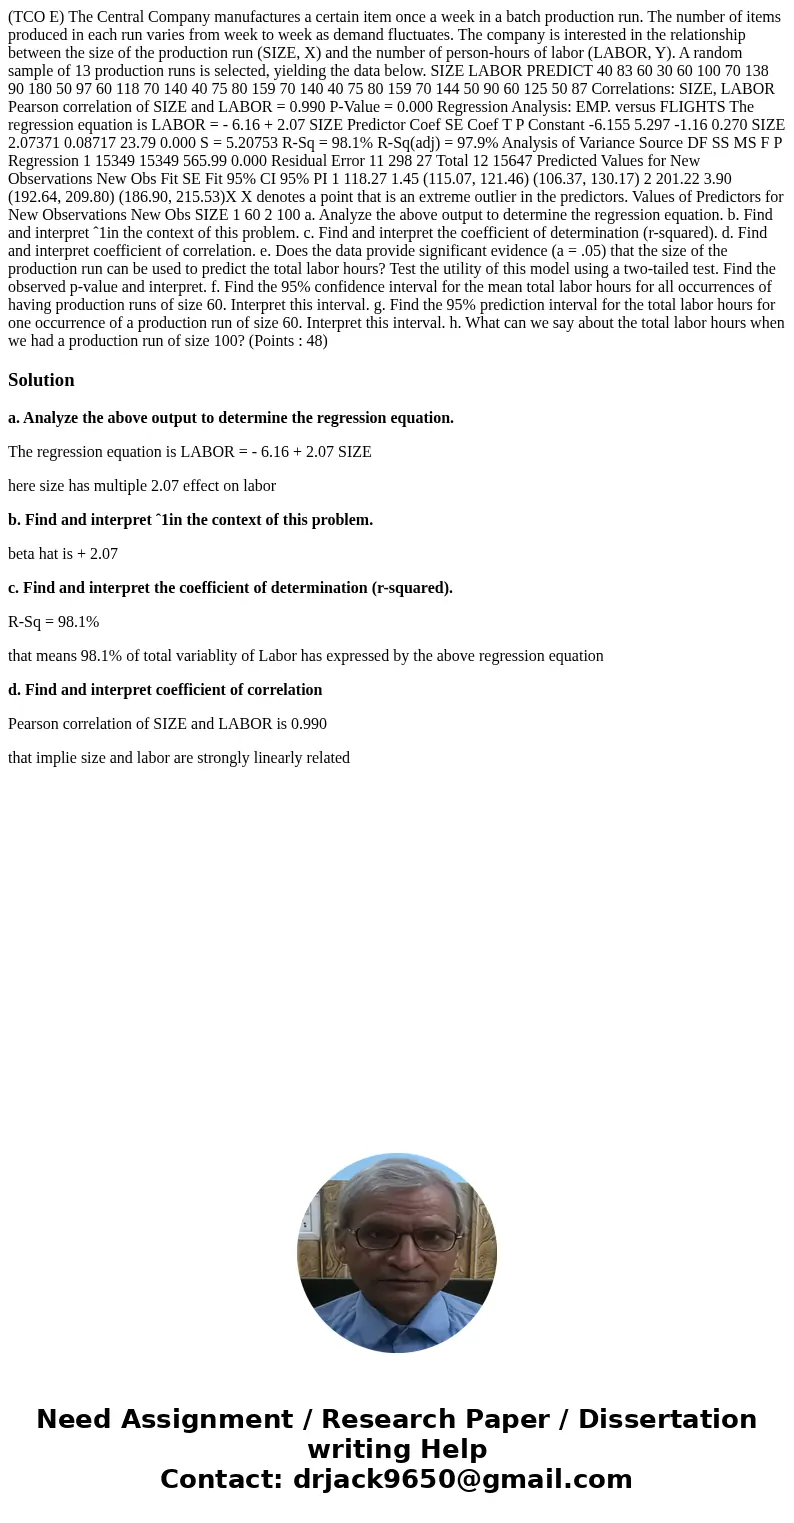
(TCO E) The Central Company manufactures a certain item once a week in a batch production run. The number of items produced in each run varies from week to week as demand fluctuates. The company is interested in the relationship between the size of the production run (SIZE, X) and the number of person-hours of labor (LABOR, Y). A random sample of 13 production runs is selected, yielding the data below. SIZE LABOR PREDICT 40 83 60 30 60 100 70 138 90 180 50 97 60 118 70 140 40 75 80 159 70 140 40 75 80 159 70 144 50 90 60 125 50 87 Correlations: SIZE, LABOR Pearson correlation of SIZE and LABOR = 0.990 P-Value = 0.000 Regression Analysis: EMP. versus FLIGHTS The regression equation is LABOR = - 6.16 + 2.07 SIZE Predictor Coef SE Coef T P Constant -6.155 5.297 -1.16 0.270 SIZE 2.07371 0.08717 23.79 0.000 S = 5.20753 R-Sq = 98.1% R-Sq(adj) = 97.9% Analysis of Variance Source DF SS MS F P Regression 1 15349 15349 565.99 0.000 Residual Error 11 298 27 Total 12 15647 Predicted Values for New Observations New Obs Fit SE Fit 95% CI 95% PI 1 118.27 1.45 (115.07, 121.46) (106.37, 130.17) 2 201.22 3.90 (192.64, 209.80) (186.90, 215.53)X X denotes a point that is an extreme outlier in the predictors. Values of Predictors for New Observations New Obs SIZE 1 60 2 100 a. Analyze the above output to determine the regression equation. b. Find and interpret ˆ1in the context of this problem. c. Find and interpret the coefficient of determination (r-squared). d. Find and interpret coefficient of correlation. e. Does the data provide significant evidence (a = .05) that the size of the production run can be used to predict the total labor hours? Test the utility of this model using a two-tailed test. Find the observed p-value and interpret. f. Find the 95% confidence interval for the mean total labor hours for all occurrences of having production runs of size 60. Interpret this interval. g. Find the 95% prediction interval for the total labor hours for one occurrence of a production run of size 60. Interpret this interval. h. What can we say about the total labor hours when we had a production run of size 100? (Points : 48)
Solution
a. Analyze the above output to determine the regression equation.
The regression equation is LABOR = - 6.16 + 2.07 SIZE
here size has multiple 2.07 effect on labor
b. Find and interpret ˆ1in the context of this problem.
beta hat is + 2.07
c. Find and interpret the coefficient of determination (r-squared).
R-Sq = 98.1%
that means 98.1% of total variablity of Labor has expressed by the above regression equation
d. Find and interpret coefficient of correlation
Pearson correlation of SIZE and LABOR is 0.990
that implie size and labor are strongly linearly related

 Homework Sourse