Compute trend percents for the following accounts using 2013
Compute trend percents for the following accounts, using 2013 as the base year (round the percents to whole numbers). State whether the situation as revealed by the trends appears to be favorable or unfavor able for each account 2017 2016 2015 2014 2013 Sales $282,880 $270,800 $252,600 $234,560 $150,000 . . sold... .. 128,200 122,080 115,280 106,440 67,000 9,000 18,100 17.300 16,400 15,200

Solution
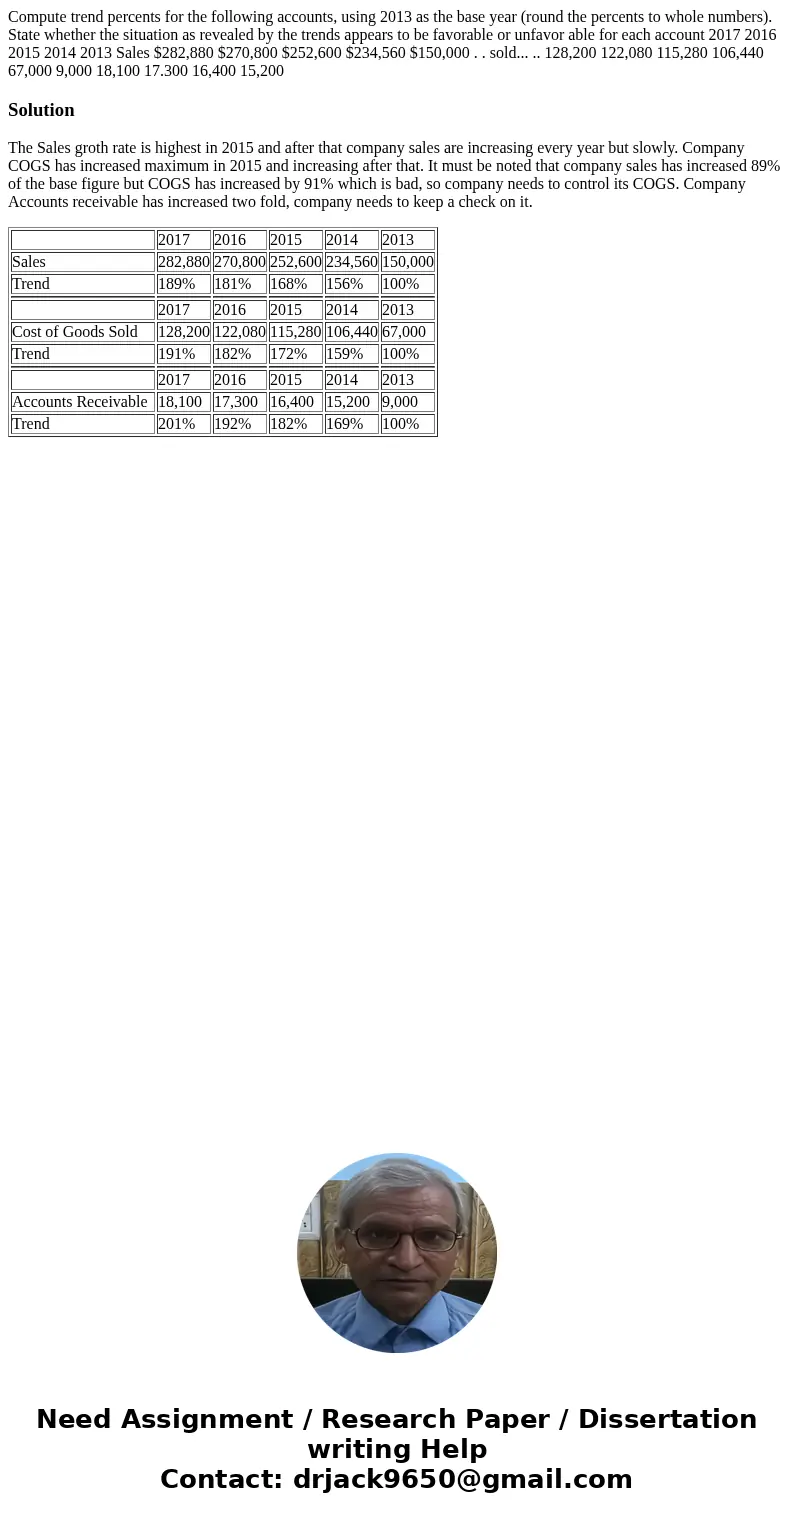
The Sales groth rate is highest in 2015 and after that company sales are increasing every year but slowly. Company COGS has increased maximum in 2015 and increasing after that. It must be noted that company sales has increased 89% of the base figure but COGS has increased by 91% which is bad, so company needs to control its COGS. Company Accounts receivable has increased two fold, company needs to keep a check on it.
| 2017 | 2016 | 2015 | 2014 | 2013 | |
| Sales | 282,880 | 270,800 | 252,600 | 234,560 | 150,000 |
| Trend | 189% | 181% | 168% | 156% | 100% |
| 2017 | 2016 | 2015 | 2014 | 2013 | |
| Cost of Goods Sold | 128,200 | 122,080 | 115,280 | 106,440 | 67,000 |
| Trend | 191% | 182% | 172% | 159% | 100% |
| 2017 | 2016 | 2015 | 2014 | 2013 | |
| Accounts Receivable | 18,100 | 17,300 | 16,400 | 15,200 | 9,000 |
| Trend | 201% | 192% | 182% | 169% | 100% |

 Homework Sourse