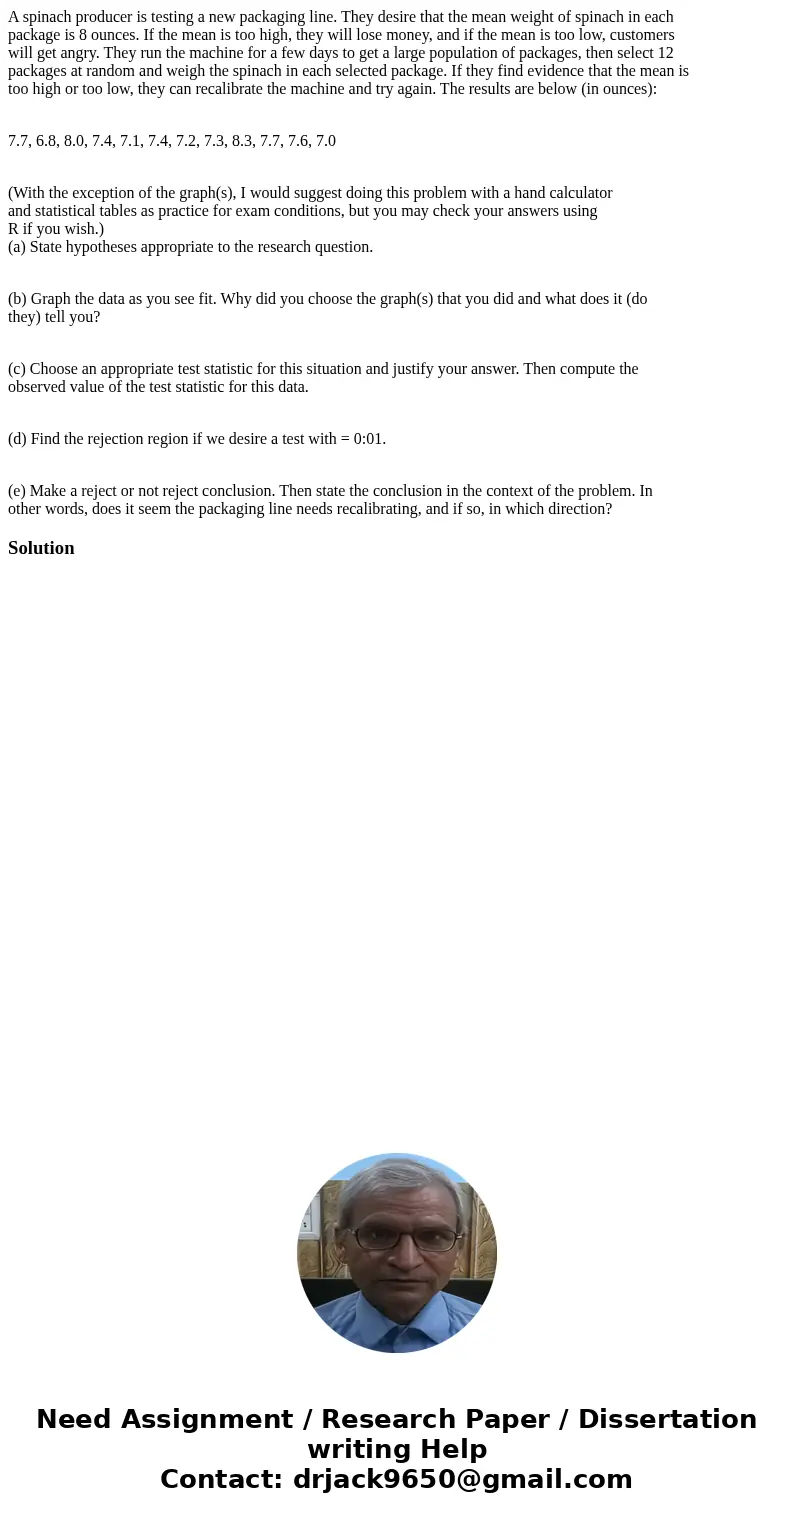
A spinach producer is testing a new packaging line They desi
A spinach producer is testing a new packaging line. They desire that the mean weight of spinach in each
package is 8 ounces. If the mean is too high, they will lose money, and if the mean is too low, customers
will get angry. They run the machine for a few days to get a large population of packages, then select 12
packages at random and weigh the spinach in each selected package. If they find evidence that the mean is
too high or too low, they can recalibrate the machine and try again. The results are below (in ounces):
7.7, 6.8, 8.0, 7.4, 7.1, 7.4, 7.2, 7.3, 8.3, 7.7, 7.6, 7.0
(With the exception of the graph(s), I would suggest doing this problem with a hand calculator
and statistical tables as practice for exam conditions, but you may check your answers using
R if you wish.)
(a) State hypotheses appropriate to the research question.
(b) Graph the data as you see fit. Why did you choose the graph(s) that you did and what does it (do
they) tell you?
(c) Choose an appropriate test statistic for this situation and justify your answer. Then compute the
observed value of the test statistic for this data.
(d) Find the rejection region if we desire a test with = 0:01.
(e) Make a reject or not reject conclusion. Then state the conclusion in the context of the problem. In
other words, does it seem the packaging line needs recalibrating, and if so, in which direction?
Solution

 Homework Sourse