Help please show work so I can understand Thanks In a manufa
Help please show work, so I can understand, Thanks!
In a manufacturing process the assembly line speed (feet per minute) was thought to affect the number of defective parts found during the inspection process. To test this theory, managers devised a situation in which the same batch of parts was inspected visually at a variety of line speeds.
Solution
Here independent variabe x = line speed.
and dependent variable y = Number of defective parts.
Can\'t copy the graph of scatter diagram from the Minitab.
a) There is positive correlation between line speed and number of defective parts found.
b) The regression equation of y on x is,
y = a + b * x
a = y-intercept = 22.2
b = regression coefficient of y on x or slope of the regression = - 0.148
Regession we can done using Minitab command is as follows:
Minitab ==>Enter the values of x and y ==> go to Stat ==>regression ==> regression ==>Response = y ==>predictors =x ==>Results =second option ==>Ok.
This will gives you the following output.
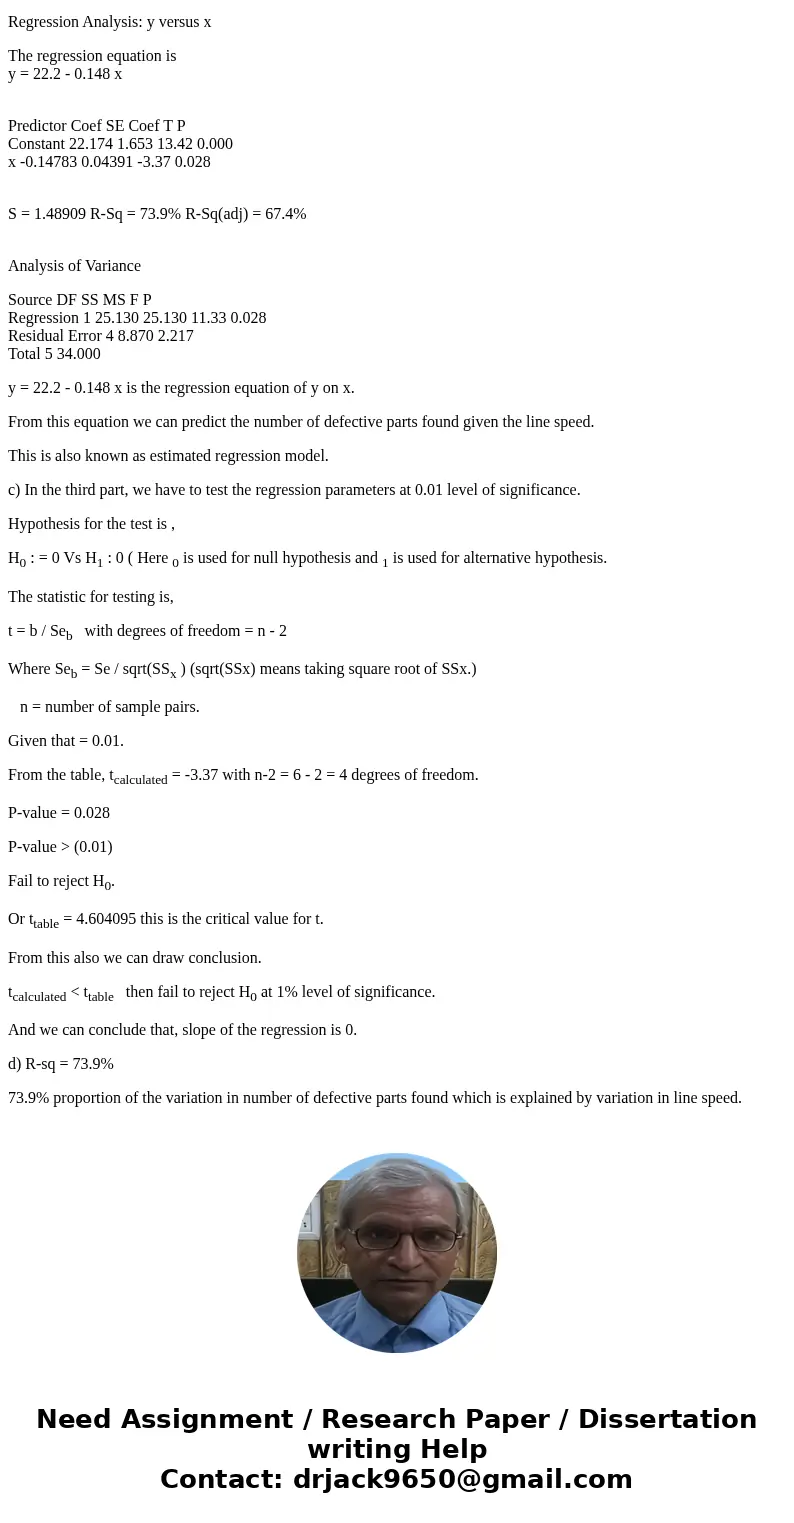
Regression Analysis: y versus x
The regression equation is
y = 22.2 - 0.148 x
Predictor Coef SE Coef T P
Constant 22.174 1.653 13.42 0.000
x -0.14783 0.04391 -3.37 0.028
S = 1.48909 R-Sq = 73.9% R-Sq(adj) = 67.4%
Analysis of Variance
Source DF SS MS F P
Regression 1 25.130 25.130 11.33 0.028
Residual Error 4 8.870 2.217
Total 5 34.000
y = 22.2 - 0.148 x is the regression equation of y on x.
From this equation we can predict the number of defective parts found given the line speed.
This is also known as estimated regression model.
c) In the third part, we have to test the regression parameters at 0.01 level of significance.
Hypothesis for the test is ,
H0 : = 0 Vs H1 : 0 ( Here 0 is used for null hypothesis and 1 is used for alternative hypothesis.
The statistic for testing is,
t = b / Seb with degrees of freedom = n - 2
Where Seb = Se / sqrt(SSx ) (sqrt(SSx) means taking square root of SSx.)
n = number of sample pairs.
Given that = 0.01.
From the table, tcalculated = -3.37 with n-2 = 6 - 2 = 4 degrees of freedom.
P-value = 0.028
P-value > (0.01)
Fail to reject H0.
Or ttable = 4.604095 this is the critical value for t.
From this also we can draw conclusion.
tcalculated < ttable then fail to reject H0 at 1% level of significance.
And we can conclude that, slope of the regression is 0.
d) R-sq = 73.9%
73.9% proportion of the variation in number of defective parts found which is explained by variation in line speed.


 Homework Sourse