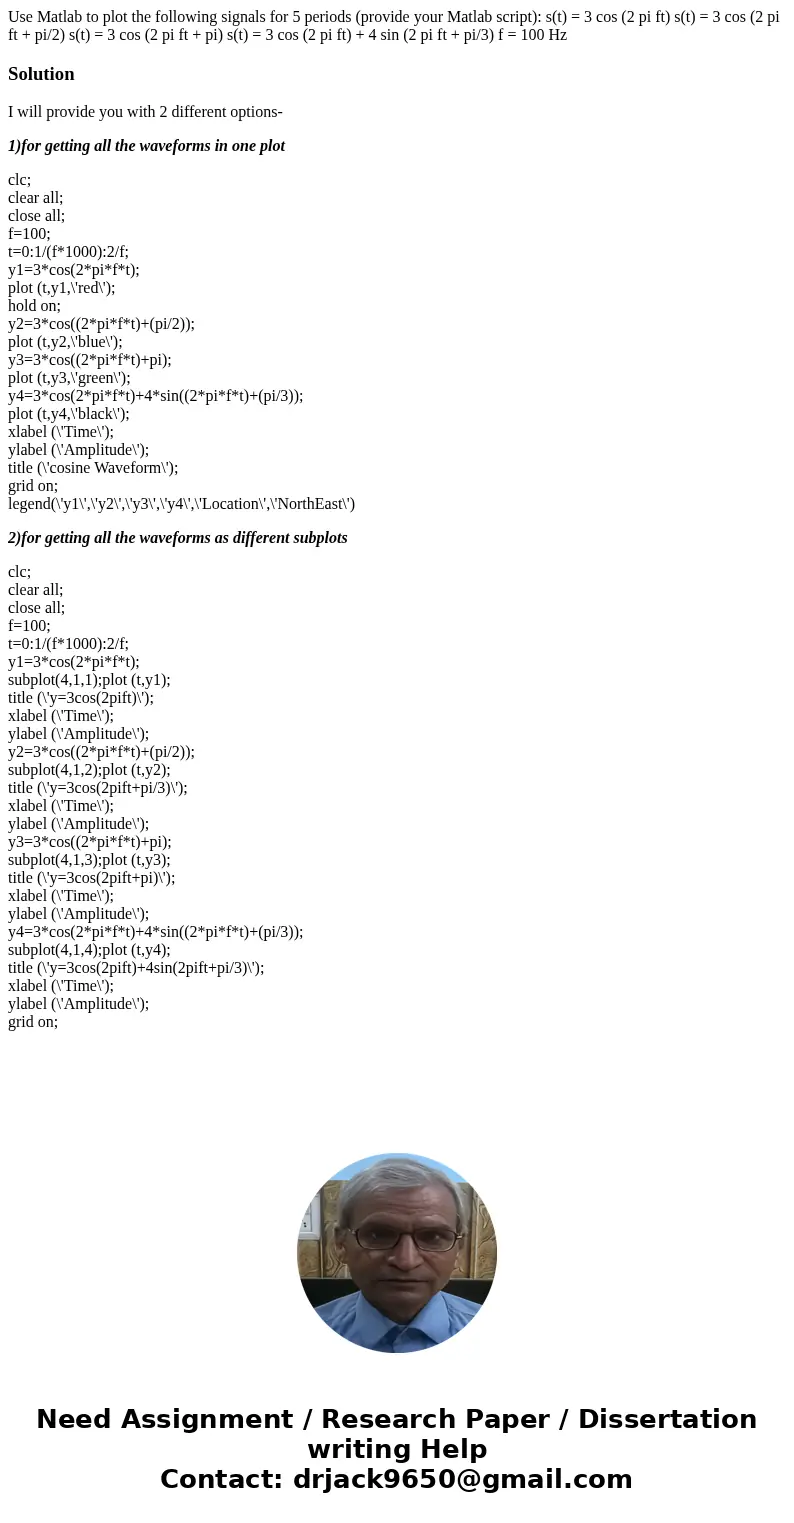
Use Matlab to plot the following signals for 5 periods provi
Solution
I will provide you with 2 different options-
1)for getting all the waveforms in one plot
clc;
clear all;
close all;
f=100;
t=0:1/(f*1000):2/f;
y1=3*cos(2*pi*f*t);
plot (t,y1,\'red\');
hold on;
y2=3*cos((2*pi*f*t)+(pi/2));
plot (t,y2,\'blue\');
y3=3*cos((2*pi*f*t)+pi);
plot (t,y3,\'green\');
y4=3*cos(2*pi*f*t)+4*sin((2*pi*f*t)+(pi/3));
plot (t,y4,\'black\');
xlabel (\'Time\');
ylabel (\'Amplitude\');
title (\'cosine Waveform\');
grid on;
legend(\'y1\',\'y2\',\'y3\',\'y4\',\'Location\',\'NorthEast\')
2)for getting all the waveforms as different subplots
clc;
clear all;
close all;
f=100;
t=0:1/(f*1000):2/f;
y1=3*cos(2*pi*f*t);
subplot(4,1,1);plot (t,y1);
title (\'y=3cos(2pift)\');
xlabel (\'Time\');
ylabel (\'Amplitude\');
y2=3*cos((2*pi*f*t)+(pi/2));
subplot(4,1,2);plot (t,y2);
title (\'y=3cos(2pift+pi/3)\');
xlabel (\'Time\');
ylabel (\'Amplitude\');
y3=3*cos((2*pi*f*t)+pi);
subplot(4,1,3);plot (t,y3);
title (\'y=3cos(2pift+pi)\');
xlabel (\'Time\');
ylabel (\'Amplitude\');
y4=3*cos(2*pi*f*t)+4*sin((2*pi*f*t)+(pi/3));
subplot(4,1,4);plot (t,y4);
title (\'y=3cos(2pift)+4sin(2pift+pi/3)\');
xlabel (\'Time\');
ylabel (\'Amplitude\');
grid on;

 Homework Sourse