The following data values represent the number of homeruns a
The following data values represent the number of homeruns a baseball player hit each year during his 25-year baseball career. Complete parts a. through d. below. 16 37 25 47 27 45 42 26 22 32 44 12 49 28 38 24 15 37 12 35 17 30 24 22 33 a. Calculate the mean of these data values. Round to two decimal places as needed.) Calculate the standard deviation of these data values S-D(Round to two decimal places as needed) b. Group this data into four classes with class boundaries of 10-under 20, 20-under 30, 30-under 40, and 40-under 50 Group Frequency c. Calculate the approximate mean of these grouped data values. Round to two decimal places as needed) 10-under 20 20-under 30 30-under 40 40-under 50 h\" (Round to one decimal place as needed.)

Solution
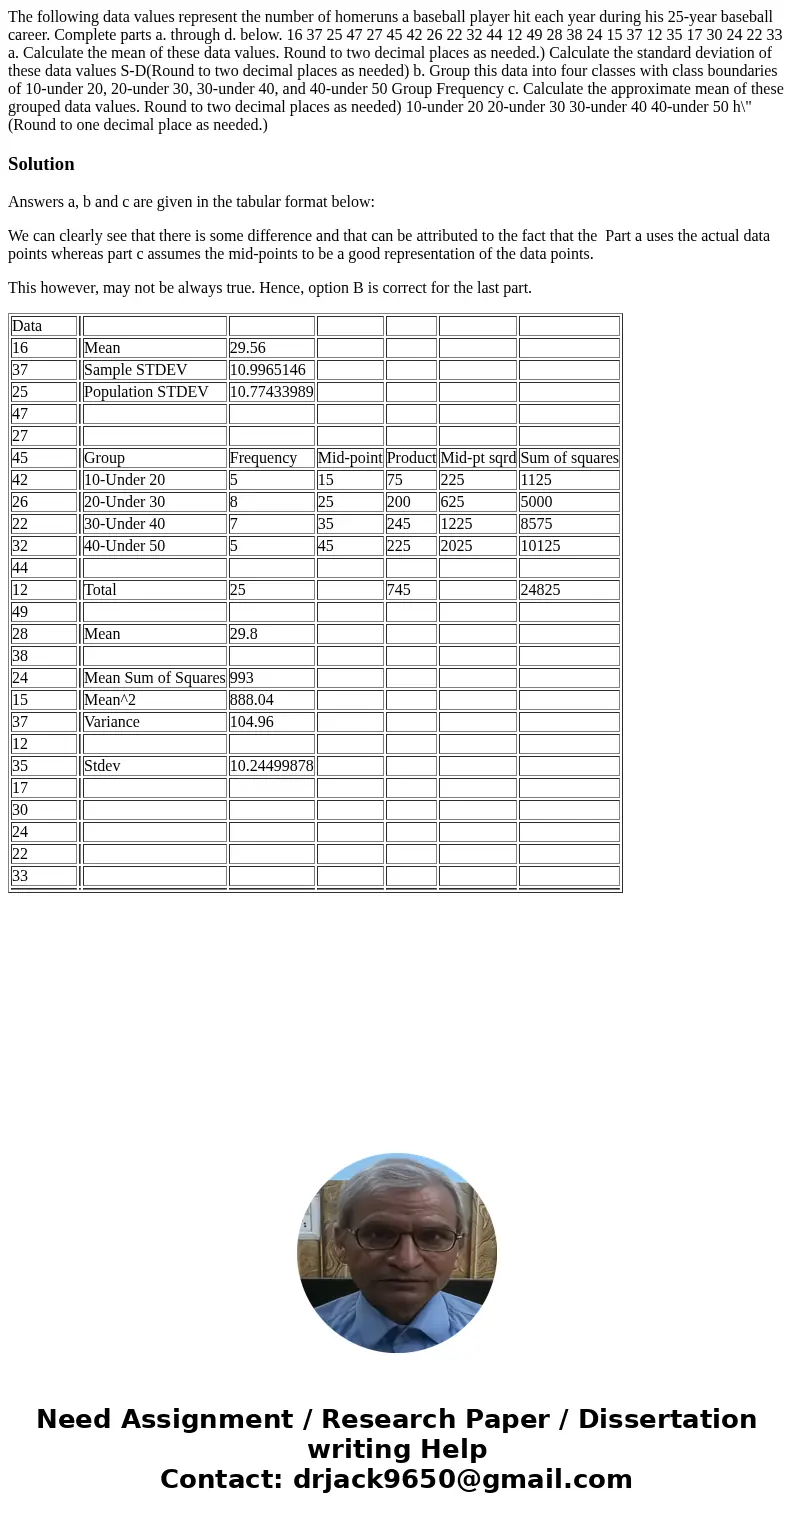
Answers a, b and c are given in the tabular format below:
We can clearly see that there is some difference and that can be attributed to the fact that the Part a uses the actual data points whereas part c assumes the mid-points to be a good representation of the data points.
This however, may not be always true. Hence, option B is correct for the last part.
| Data | |||||||
| 16 | Mean | 29.56 | |||||
| 37 | Sample STDEV | 10.9965146 | |||||
| 25 | Population STDEV | 10.77433989 | |||||
| 47 | |||||||
| 27 | |||||||
| 45 | Group | Frequency | Mid-point | Product | Mid-pt sqrd | Sum of squares | |
| 42 | 10-Under 20 | 5 | 15 | 75 | 225 | 1125 | |
| 26 | 20-Under 30 | 8 | 25 | 200 | 625 | 5000 | |
| 22 | 30-Under 40 | 7 | 35 | 245 | 1225 | 8575 | |
| 32 | 40-Under 50 | 5 | 45 | 225 | 2025 | 10125 | |
| 44 | |||||||
| 12 | Total | 25 | 745 | 24825 | |||
| 49 | |||||||
| 28 | Mean | 29.8 | |||||
| 38 | |||||||
| 24 | Mean Sum of Squares | 993 | |||||
| 15 | Mean^2 | 888.04 | |||||
| 37 | Variance | 104.96 | |||||
| 12 | |||||||
| 35 | Stdev | 10.24499878 | |||||
| 17 | |||||||
| 30 | |||||||
| 24 | |||||||
| 22 | |||||||
| 33 | |||||||

 Homework Sourse