4 test compute the PValue Health inspections The New York Ci
4 test
compute the P-Value
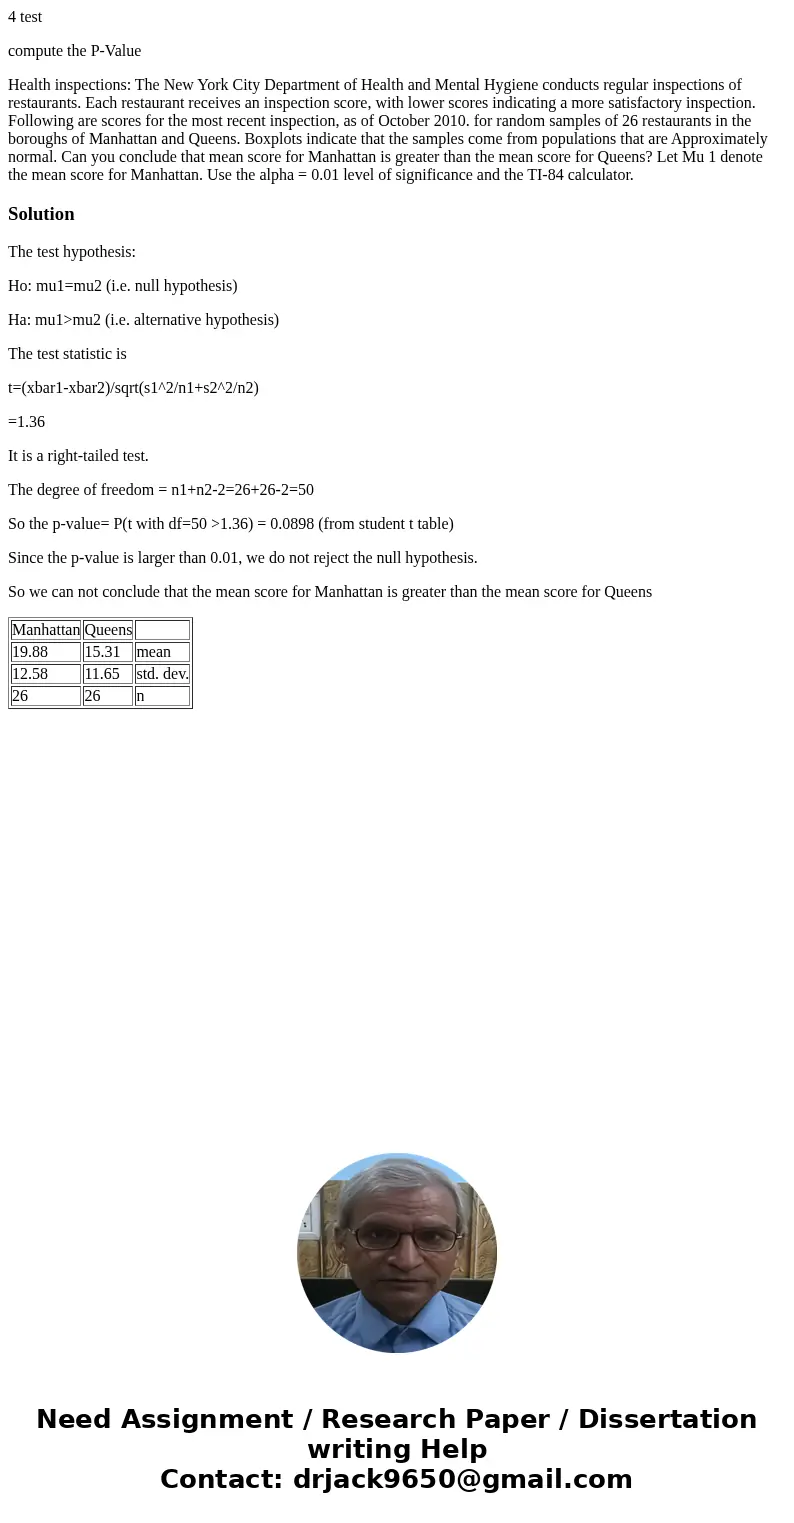
Health inspections: The New York City Department of Health and Mental Hygiene conducts regular inspections of restaurants. Each restaurant receives an inspection score, with lower scores indicating a more satisfactory inspection. Following are scores for the most recent inspection, as of October 2010. for random samples of 26 restaurants in the boroughs of Manhattan and Queens. Boxplots indicate that the samples come from populations that are Approximately normal. Can you conclude that mean score for Manhattan is greater than the mean score for Queens? Let Mu 1 denote the mean score for Manhattan. Use the alpha = 0.01 level of significance and the TI-84 calculator.Solution
The test hypothesis:
Ho: mu1=mu2 (i.e. null hypothesis)
Ha: mu1>mu2 (i.e. alternative hypothesis)
The test statistic is
t=(xbar1-xbar2)/sqrt(s1^2/n1+s2^2/n2)
=1.36
It is a right-tailed test.
The degree of freedom = n1+n2-2=26+26-2=50
So the p-value= P(t with df=50 >1.36) = 0.0898 (from student t table)
Since the p-value is larger than 0.01, we do not reject the null hypothesis.
So we can not conclude that the mean score for Manhattan is greater than the mean score for Queens
| Manhattan | Queens | |
| 19.88 | 15.31 | mean |
| 12.58 | 11.65 | std. dev. |
| 26 | 26 | n |

 Homework Sourse