please Clearly present the cash flow diagrams equivalency mo
please Clearly present the cash flow diagram(s), equivalency model(s),
assumptions made and detailed calculations. ( dont use exel tables)
A manufacturing firm purchases some machinery in January for $1,000,000. The machinery has an estimated life of 5 years, with an estimated salvage value of $200,000. The use of this machinery should generate $400,000 before-tax profit each year over its 5-year useful life. Calculate the before-tax and after-tax rates of return if the company uses declining balance at 150% to depreciate their assets.
Solution
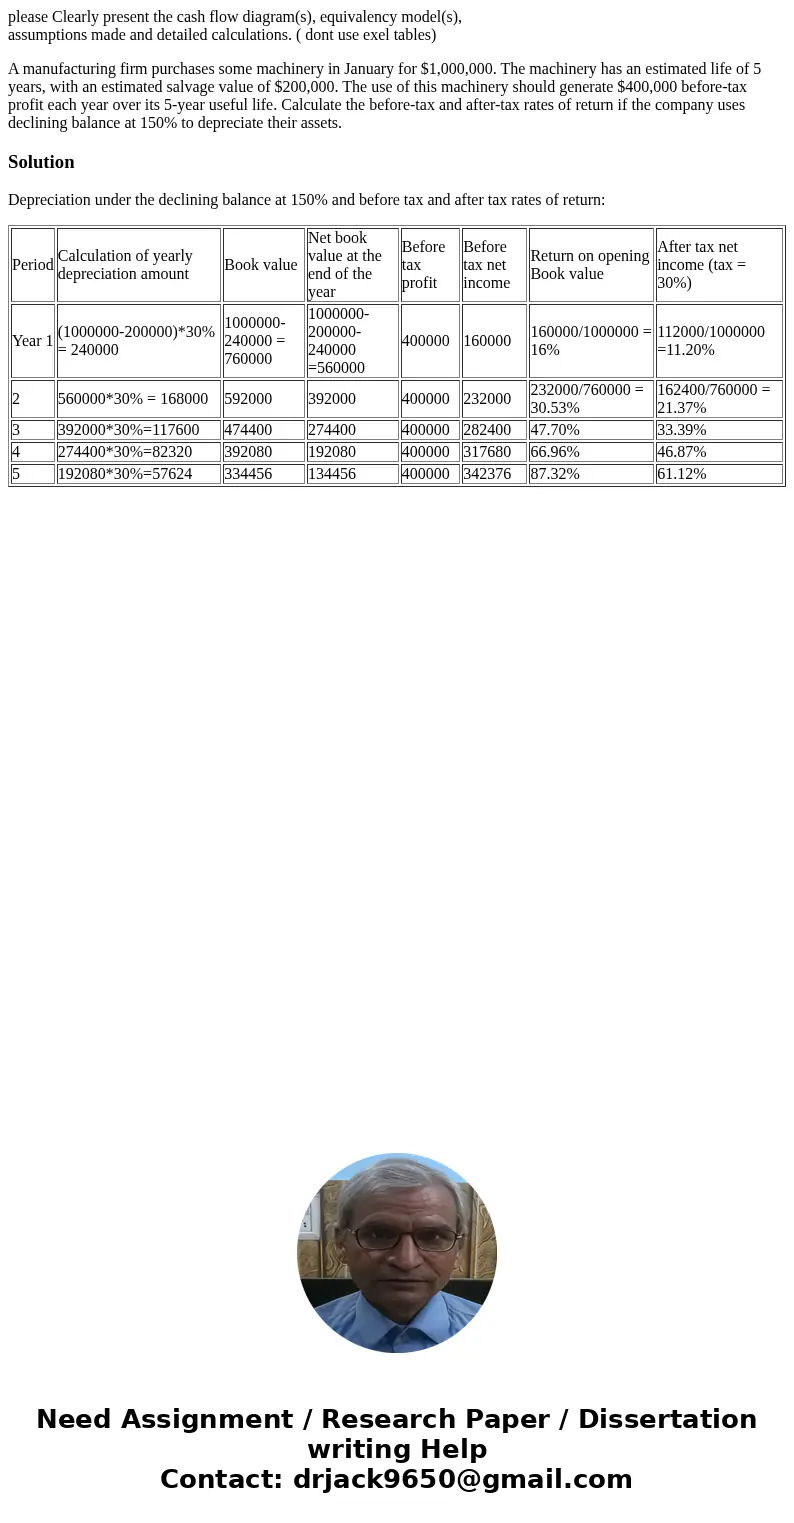
Depreciation under the declining balance at 150% and before tax and after tax rates of return:
| Period | Calculation of yearly depreciation amount | Book value | Net book value at the end of the year | Before tax profit | Before tax net income | Return on opening Book value | After tax net income (tax = 30%) |
| Year 1 | (1000000-200000)*30% = 240000 | 1000000-240000 = 760000 | 1000000-200000-240000 =560000 | 400000 | 160000 | 160000/1000000 = 16% | 112000/1000000 =11.20% |
| 2 | 560000*30% = 168000 | 592000 | 392000 | 400000 | 232000 | 232000/760000 = 30.53% | 162400/760000 = 21.37% |
| 3 | 392000*30%=117600 | 474400 | 274400 | 400000 | 282400 | 47.70% | 33.39% |
| 4 | 274400*30%=82320 | 392080 | 192080 | 400000 | 317680 | 66.96% | 46.87% |
| 5 | 192080*30%=57624 | 334456 | 134456 | 400000 | 342376 | 87.32% | 61.12% |

 Homework Sourse