Shown below is a portion of a computer output for a regressi
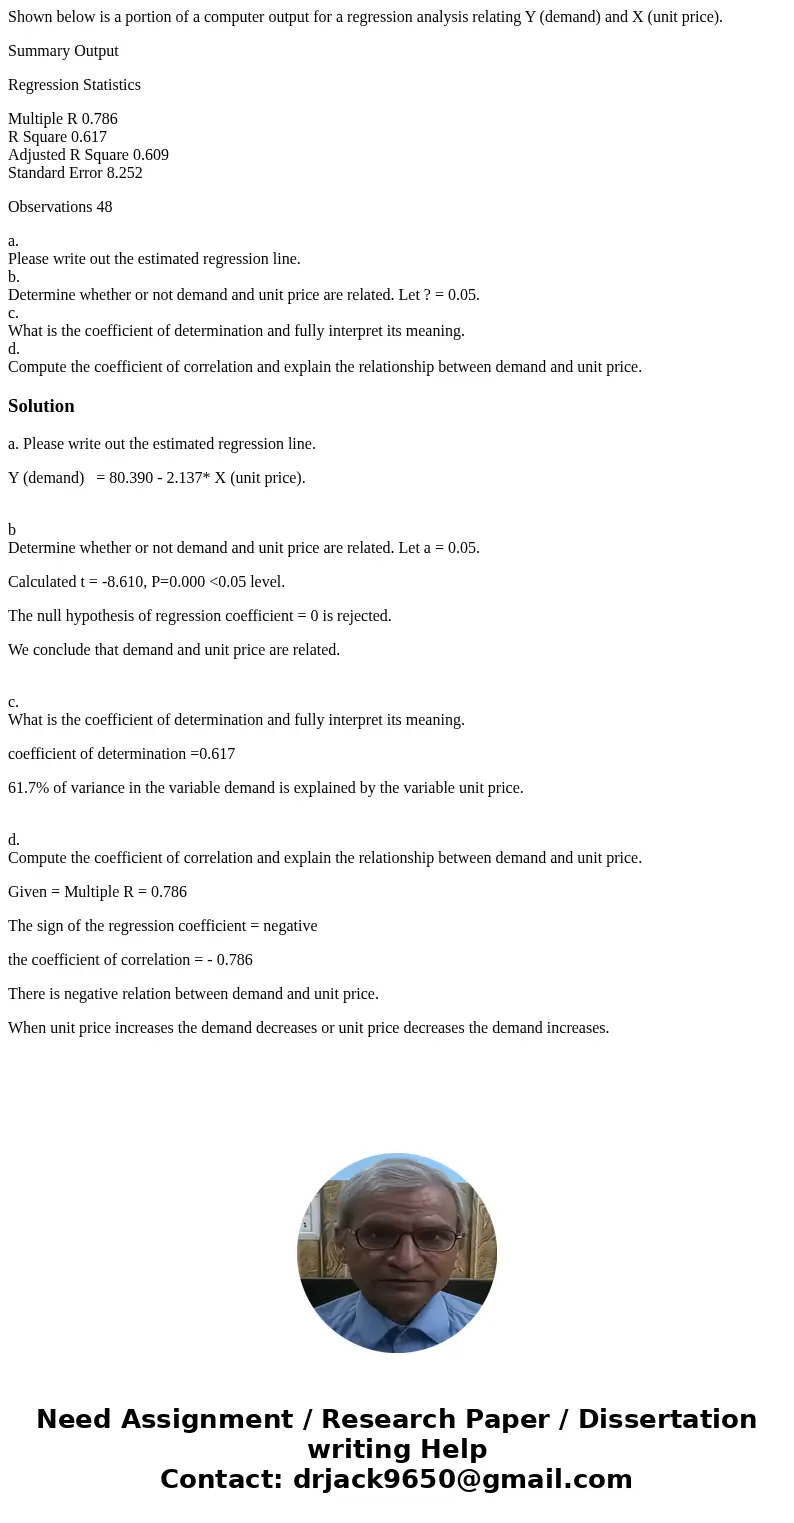
Shown below is a portion of a computer output for a regression analysis relating Y (demand) and X (unit price).
Summary Output
Regression Statistics
Multiple R 0.786
R Square 0.617
Adjusted R Square 0.609
Standard Error 8.252
Observations 48
a.
Please write out the estimated regression line.
b.
Determine whether or not demand and unit price are related. Let ? = 0.05.
c.
What is the coefficient of determination and fully interpret its meaning.
d.
Compute the coefficient of correlation and explain the relationship between demand and unit price.
Solution
a. Please write out the estimated regression line.
Y (demand) = 80.390 - 2.137* X (unit price).
b
Determine whether or not demand and unit price are related. Let a = 0.05.
Calculated t = -8.610, P=0.000 <0.05 level.
The null hypothesis of regression coefficient = 0 is rejected.
We conclude that demand and unit price are related.
c.
What is the coefficient of determination and fully interpret its meaning.
coefficient of determination =0.617
61.7% of variance in the variable demand is explained by the variable unit price.
d.
Compute the coefficient of correlation and explain the relationship between demand and unit price.
Given = Multiple R = 0.786
The sign of the regression coefficient = negative
the coefficient of correlation = - 0.786
There is negative relation between demand and unit price.
When unit price increases the demand decreases or unit price decreases the demand increases.

 Homework Sourse