statistics Samsung had 100 business student try wo different
statistics
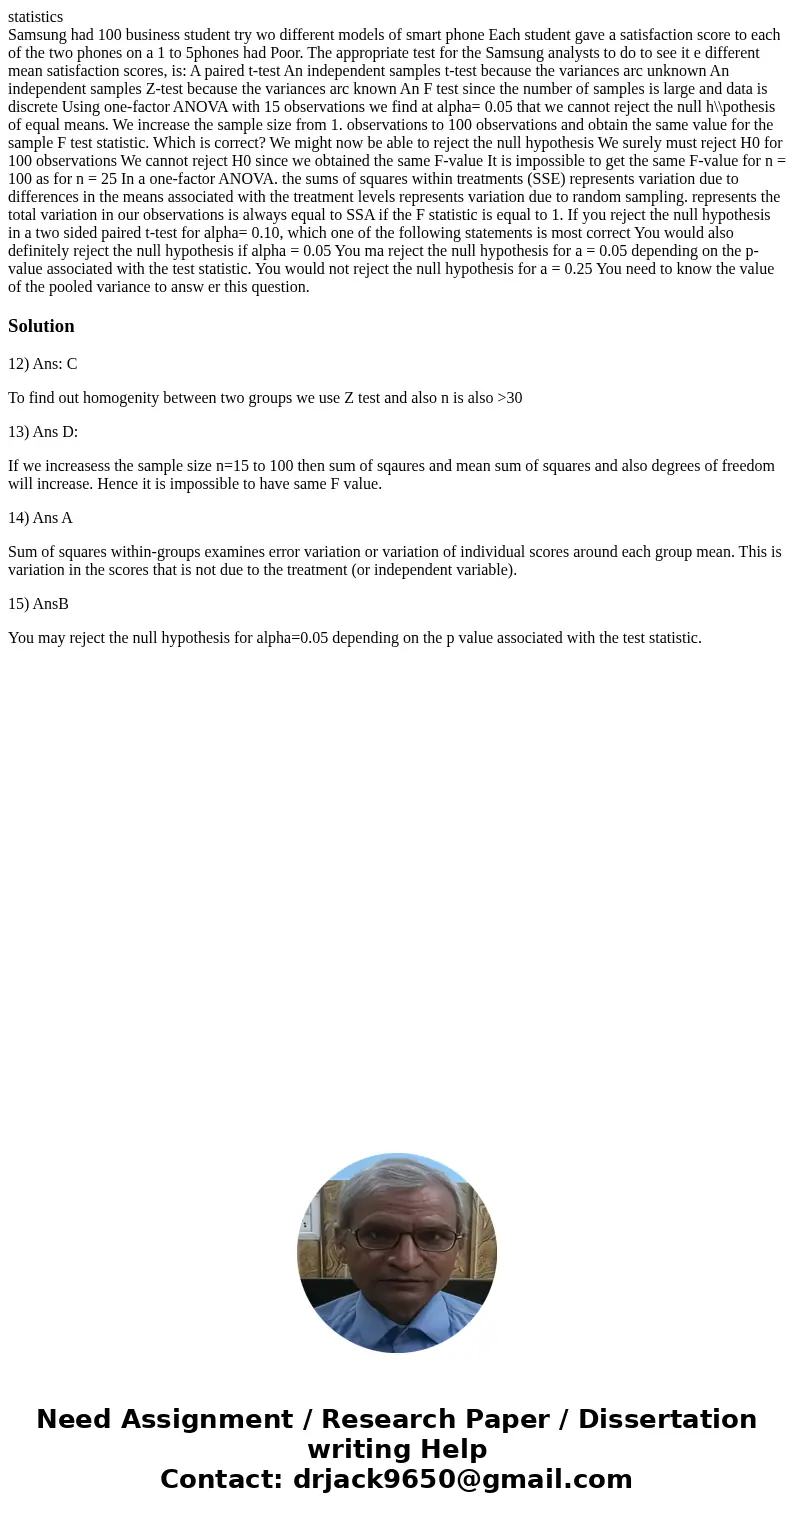
Samsung had 100 business student try wo different models of smart phone Each student gave a satisfaction score to each of the two phones on a 1 to 5phones had Poor. The appropriate test for the Samsung analysts to do to see it e different mean satisfaction scores, is: A paired t-test An independent samples t-test because the variances arc unknown An independent samples Z-test because the variances arc known An F test since the number of samples is large and data is discrete Using one-factor ANOVA with 15 observations we find at alpha= 0.05 that we cannot reject the null h\\pothesis of equal means. We increase the sample size from 1. observations to 100 observations and obtain the same value for the sample F test statistic. Which is correct? We might now be able to reject the null hypothesis We surely must reject H0 for 100 observations We cannot reject H0 since we obtained the same F-value It is impossible to get the same F-value for n = 100 as for n = 25 In a one-factor ANOVA. the sums of squares within treatments (SSE) represents variation due to differences in the means associated with the treatment levels represents variation due to random sampling. represents the total variation in our observations is always equal to SSA if the F statistic is equal to 1. If you reject the null hypothesis in a two sided paired t-test for alpha= 0.10, which one of the following statements is most correct You would also definitely reject the null hypothesis if alpha = 0.05 You ma reject the null hypothesis for a = 0.05 depending on the p-value associated with the test statistic. You would not reject the null hypothesis for a = 0.25 You need to know the value of the pooled variance to answ er this question.Solution
12) Ans: C
To find out homogenity between two groups we use Z test and also n is also >30
13) Ans D:
If we increasess the sample size n=15 to 100 then sum of sqaures and mean sum of squares and also degrees of freedom will increase. Hence it is impossible to have same F value.
14) Ans A
Sum of squares within-groups examines error variation or variation of individual scores around each group mean. This is variation in the scores that is not due to the treatment (or independent variable).
15) AnsB
You may reject the null hypothesis for alpha=0.05 depending on the p value associated with the test statistic.

 Homework Sourse