Myrtle Bay Marine Supply Income Statements For the Years End
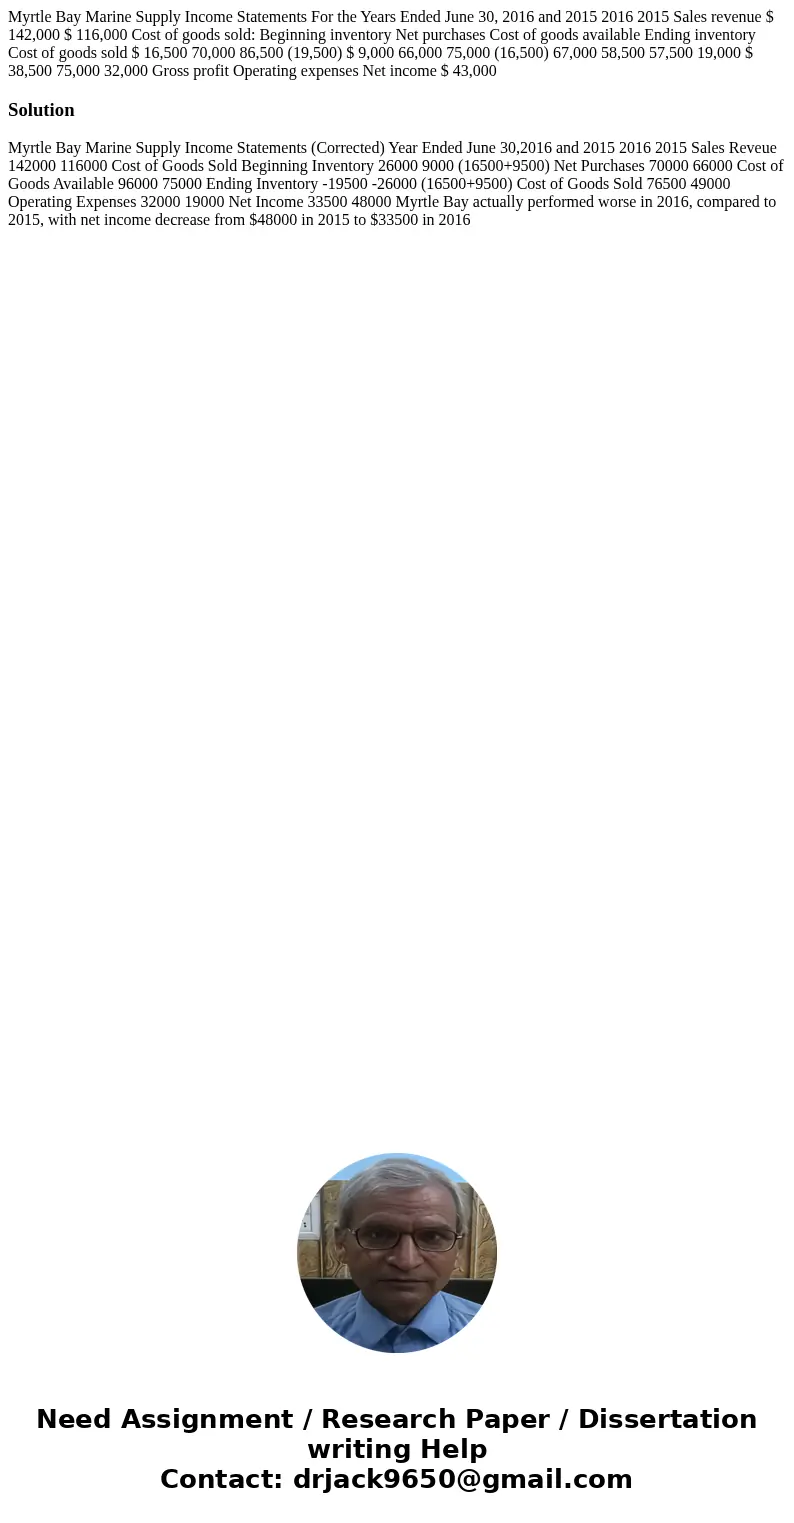
Myrtle Bay Marine Supply Income Statements For the Years Ended June 30, 2016 and 2015 2016 2015 Sales revenue $ 142,000 $ 116,000 Cost of goods sold: Beginning inventory Net purchases Cost of goods available Ending inventory Cost of goods sold $ 16,500 70,000 86,500 (19,500) $ 9,000 66,000 75,000 (16,500) 67,000 58,500 57,500 19,000 $ 38,500 75,000 32,000 Gross profit Operating expenses Net income $ 43,000 
Solution
Myrtle Bay Marine Supply Income Statements (Corrected) Year Ended June 30,2016 and 2015 2016 2015 Sales Reveue 142000 116000 Cost of Goods Sold Beginning Inventory 26000 9000 (16500+9500) Net Purchases 70000 66000 Cost of Goods Available 96000 75000 Ending Inventory -19500 -26000 (16500+9500) Cost of Goods Sold 76500 49000 Operating Expenses 32000 19000 Net Income 33500 48000 Myrtle Bay actually performed worse in 2016, compared to 2015, with net income decrease from $48000 in 2015 to $33500 in 2016
 Homework Sourse