Using the data below Year Flow develop a histogram a prob
Using the data below ( Year & Flow ), develop a histogram; a probability plot, and use chi-square goodness-of-fit test against normal distribution. Based on the analysis, state your conclustion.
Please provide a detailed response, it will be vary helpful. If you are using a software to plot. please provide a title of the software and any commands used to reach your answer. Again , the more detail the easyier it will be for me to understand your answer and check your work . Thank you ! : -^)
Year
1895
Flow (Cfs)
47300
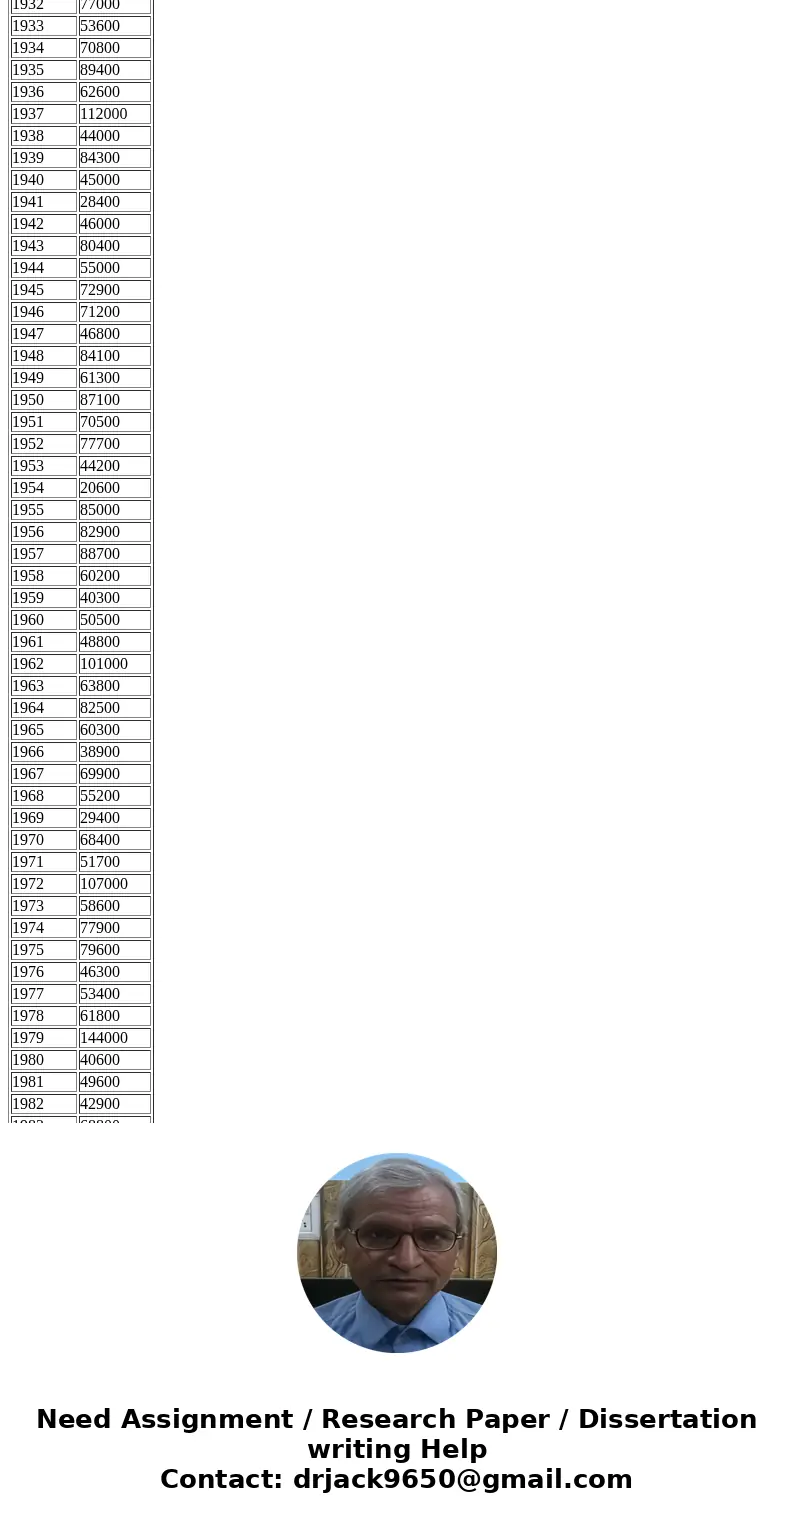
| Year 1895 | Flow (Cfs) 47300 |
| 1896 | 54400 |
| 1897 | 87200 |
| 1898 | 65700 |
| 1899 | 91500 |
| 1900 | 53500 |
| 1901 | 67800 |
| 1902 | 70000 |
| 1903 | 66900 |
| 1904 | 34700 |
| 1905 | 58000 |
| 1906 | 47000 |
| 1907 | 66300 |
| 1908 | 80900 |
| 1909 | 80000 |
| 1910 | 52300 |
| 1911 | 58000 |
| 1912 | 67200 |
| 1913 | 115000 |
| 1914 | 46100 |
| 1915 | 52400 |
| 1916 | 94300 |
| 1917 | 111000 |
| 1918 | 71700 |
| 1919 | 96100 |
| 1920 | 92500 |
| 1921 | 34100 |
| 1922 | 69000 |
| 1923 | 73400 |
| 1924 | 99100 |
| 1925 | 79200 |
| 1926 | 62600 |
| 1927 | 93700 |
| 1928 | 68700 |
| 1929 | 80100 |
| 1930 | 32300 |
| 1931 | 43100 |
| 1932 | 77000 |
| 1933 | 53600 |
| 1934 | 70800 |
| 1935 | 89400 |
| 1936 | 62600 |
| 1937 | 112000 |
| 1938 | 44000 |
| 1939 | 84300 |
| 1940 | 45000 |
| 1941 | 28400 |
| 1942 | 46000 |
| 1943 | 80400 |
| 1944 | 55000 |
| 1945 | 72900 |
| 1946 | 71200 |
| 1947 | 46800 |
| 1948 | 84100 |
| 1949 | 61300 |
| 1950 | 87100 |
| 1951 | 70500 |
| 1952 | 77700 |
| 1953 | 44200 |
| 1954 | 20600 |
| 1955 | 85000 |
| 1956 | 82900 |
| 1957 | 88700 |
| 1958 | 60200 |
| 1959 | 40300 |
| 1960 | 50500 |
| 1961 | 48800 |
| 1962 | 101000 |
| 1963 | 63800 |
| 1964 | 82500 |
| 1965 | 60300 |
| 1966 | 38900 |
| 1967 | 69900 |
| 1968 | 55200 |
| 1969 | 29400 |
| 1970 | 68400 |
| 1971 | 51700 |
| 1972 | 107000 |
| 1973 | 58600 |
| 1974 | 77900 |
| 1975 | 79600 |
| 1976 | 46300 |
| 1977 | 53400 |
| 1978 | 61800 |
| 1979 | 144000 |
| 1980 | 40600 |
| 1981 | 49600 |
| 1982 | 42900 |
| 1983 | 68800 |
| 1984 | 98400 |
| 1985 | 36500 |
| 1986 | 42100 |
| 1987 | 35100 |
| 1988 | 105000 |
| 1989 | 53600 |
| 1990 | 82900 |
| 1991 | 54600 |
| 1992 | 52100 |
| 1993 | 71000 |
| mean | 66538.38 |
| stdev | 22320.22 |
Solution
Using R-software
Flow=c(47300,54400,87200,65700,91500,53500,67800,70000,66900,34700,58000,47000,66300,80900
,80000,52300,58000,67200,115000,46100,52400,94300,111000,71700,96100,92500,34100,69000,73400
,99100,79200,62600,93700,68700,80100,32300,43100,77000,53600,70800,89400,62600,112000,44000
,84300,45000,28400,46000,80400,55000,72900,71200,46800,84100,61300,87100,70500,77700,44200,
20600,85000,82900,88700,60200,40300,50500,48800,101000,63800,82500,60300,38900,69900,55200,
29400,68400,51700,107000,58600,77900,79600,46300,53400,61800,144000,40600,49600,42900,68800,
98400,36500,42100,35100,105000,53600,82900,54600,52100,71000)
hist(Flow, main=\"Histogram of Flow (Cfs)\")
Using Excel
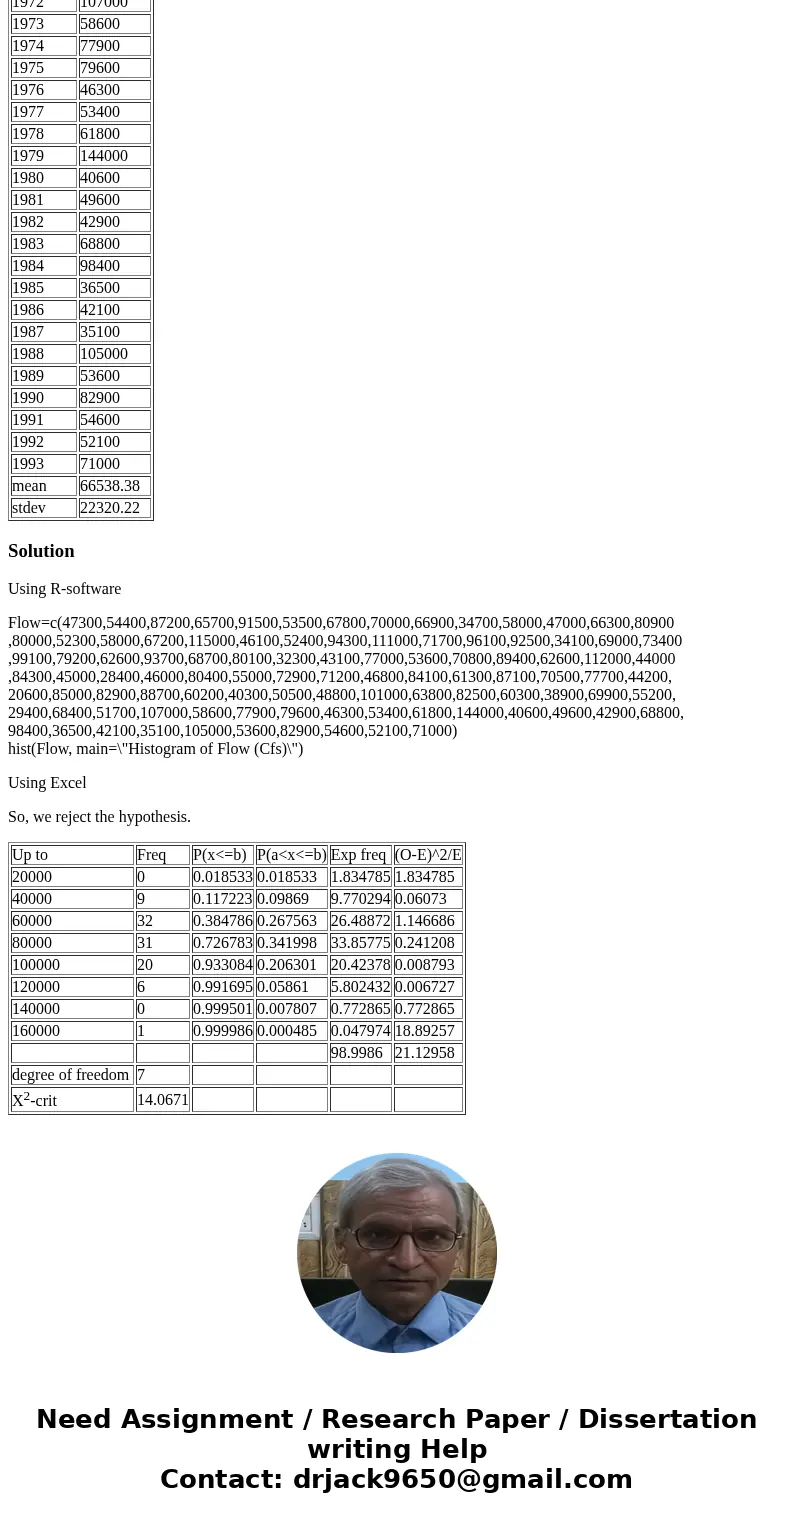
So, we reject the hypothesis.
| Up to | Freq | P(x<=b) | P(a<x<=b) | Exp freq | (O-E)^2/E |
| 20000 | 0 | 0.018533 | 0.018533 | 1.834785 | 1.834785 |
| 40000 | 9 | 0.117223 | 0.09869 | 9.770294 | 0.06073 |
| 60000 | 32 | 0.384786 | 0.267563 | 26.48872 | 1.146686 |
| 80000 | 31 | 0.726783 | 0.341998 | 33.85775 | 0.241208 |
| 100000 | 20 | 0.933084 | 0.206301 | 20.42378 | 0.008793 |
| 120000 | 6 | 0.991695 | 0.05861 | 5.802432 | 0.006727 |
| 140000 | 0 | 0.999501 | 0.007807 | 0.772865 | 0.772865 |
| 160000 | 1 | 0.999986 | 0.000485 | 0.047974 | 18.89257 |
| 98.9986 | 21.12958 | ||||
| degree of freedom | 7 | ||||
| X2-crit | 14.0671 |


 Homework Sourse