In a survey of 2967adults a poll asked people whether they s
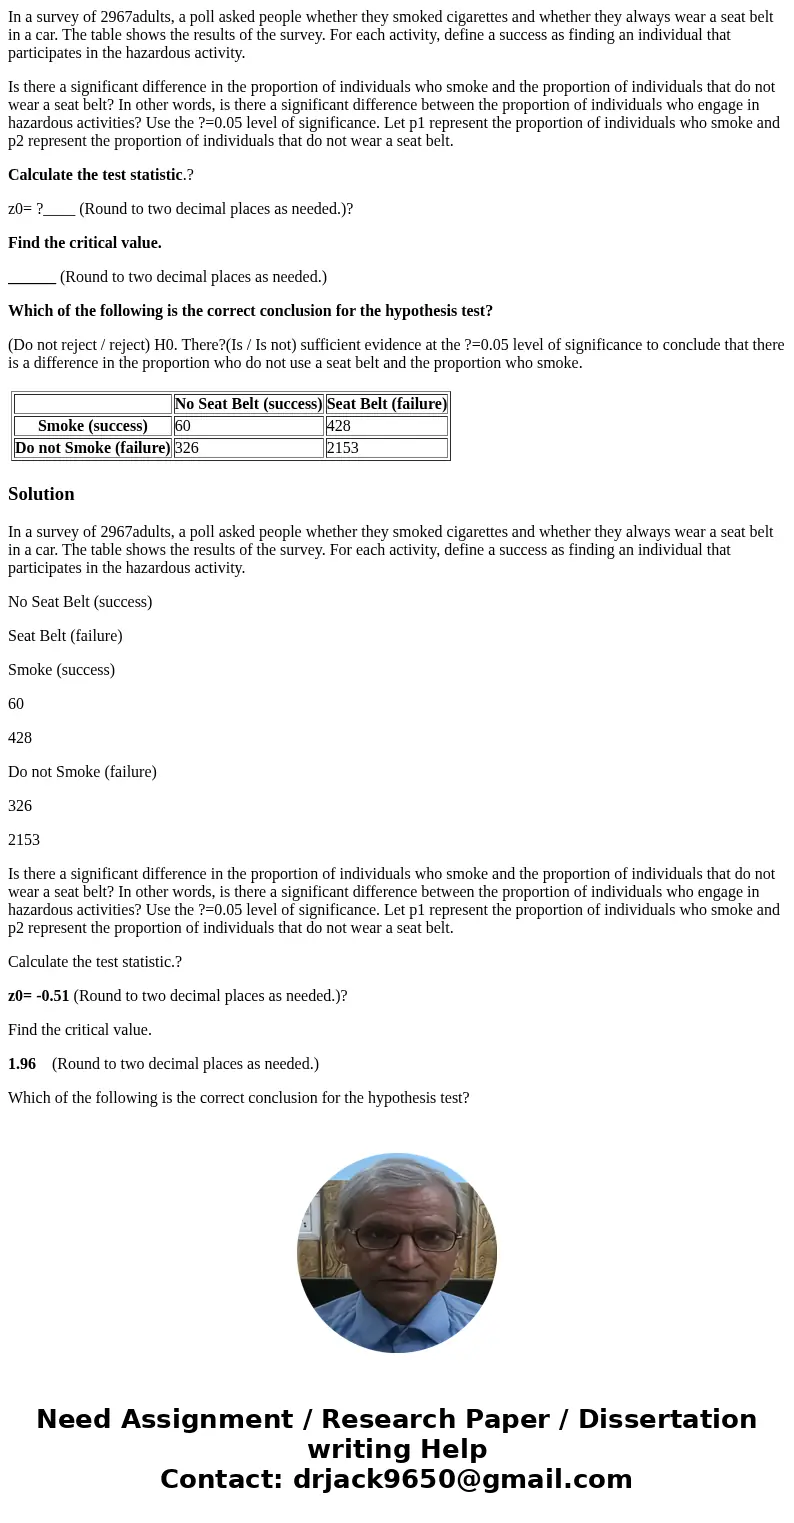
In a survey of 2967adults, a poll asked people whether they smoked cigarettes and whether they always wear a seat belt in a car. The table shows the results of the survey. For each activity, define a success as finding an individual that participates in the hazardous activity.
Is there a significant difference in the proportion of individuals who smoke and the proportion of individuals that do not wear a seat belt? In other words, is there a significant difference between the proportion of individuals who engage in hazardous activities? Use the ?=0.05 level of significance. Let p1 represent the proportion of individuals who smoke and p2 represent the proportion of individuals that do not wear a seat belt.
Calculate the test statistic.?
z0= ?____ (Round to two decimal places as needed.)?
Find the critical value.
______ (Round to two decimal places as needed.)
Which of the following is the correct conclusion for the hypothesis test?
(Do not reject / reject) H0. There?(Is / Is not) sufficient evidence at the ?=0.05 level of significance to conclude that there is a difference in the proportion who do not use a seat belt and the proportion who smoke.
|
Solution
In a survey of 2967adults, a poll asked people whether they smoked cigarettes and whether they always wear a seat belt in a car. The table shows the results of the survey. For each activity, define a success as finding an individual that participates in the hazardous activity.
No Seat Belt (success)
Seat Belt (failure)
Smoke (success)
60
428
Do not Smoke (failure)
326
2153
Is there a significant difference in the proportion of individuals who smoke and the proportion of individuals that do not wear a seat belt? In other words, is there a significant difference between the proportion of individuals who engage in hazardous activities? Use the ?=0.05 level of significance. Let p1 represent the proportion of individuals who smoke and p2 represent the proportion of individuals that do not wear a seat belt.
Calculate the test statistic.?
z0= -0.51 (Round to two decimal places as needed.)?
Find the critical value.
1.96 (Round to two decimal places as needed.)
Which of the following is the correct conclusion for the hypothesis test?
(Do not reject / reject) H0.
There?(Is / Is not) sufficient evidence at the ?=0.05 level of significance to conclude that there is a difference in the proportion who do not use a seat belt and the proportion who smoke.
Z Test for Differences in Two Proportions
Data
Hypothesized Difference
0
Level of Significance
0.05
Group 1
Number of Items of Interest
60
Sample Size
386
Group 2
Number of Items of Interest
428
Sample Size
2581
Intermediate Calculations
Group 1 Proportion
0.155440415
Group 2 Proportion
0.165827199
Difference in Two Proportions
-0.01038678
Average Proportion
0.1645
Z Test Statistic
-0.5134
Two-Tail Test
Lower Critical Value
-1.9600
Upper Critical Value
1.9600
p-Value
0.6077
Do not reject the null hypothesis
| ||||||||||


 Homework Sourse