In each time period a certain stock either goes down 1 with
In each time period, a certain stock either goes down 1 with probability .39, remains the same with probability .20, or goes up 1 with probability .41. Asuming that the changes in successive time pe- riods are independent, approximate the probability that, after 700 time periods, the stock will be up more than 10 from where it started.
Solution
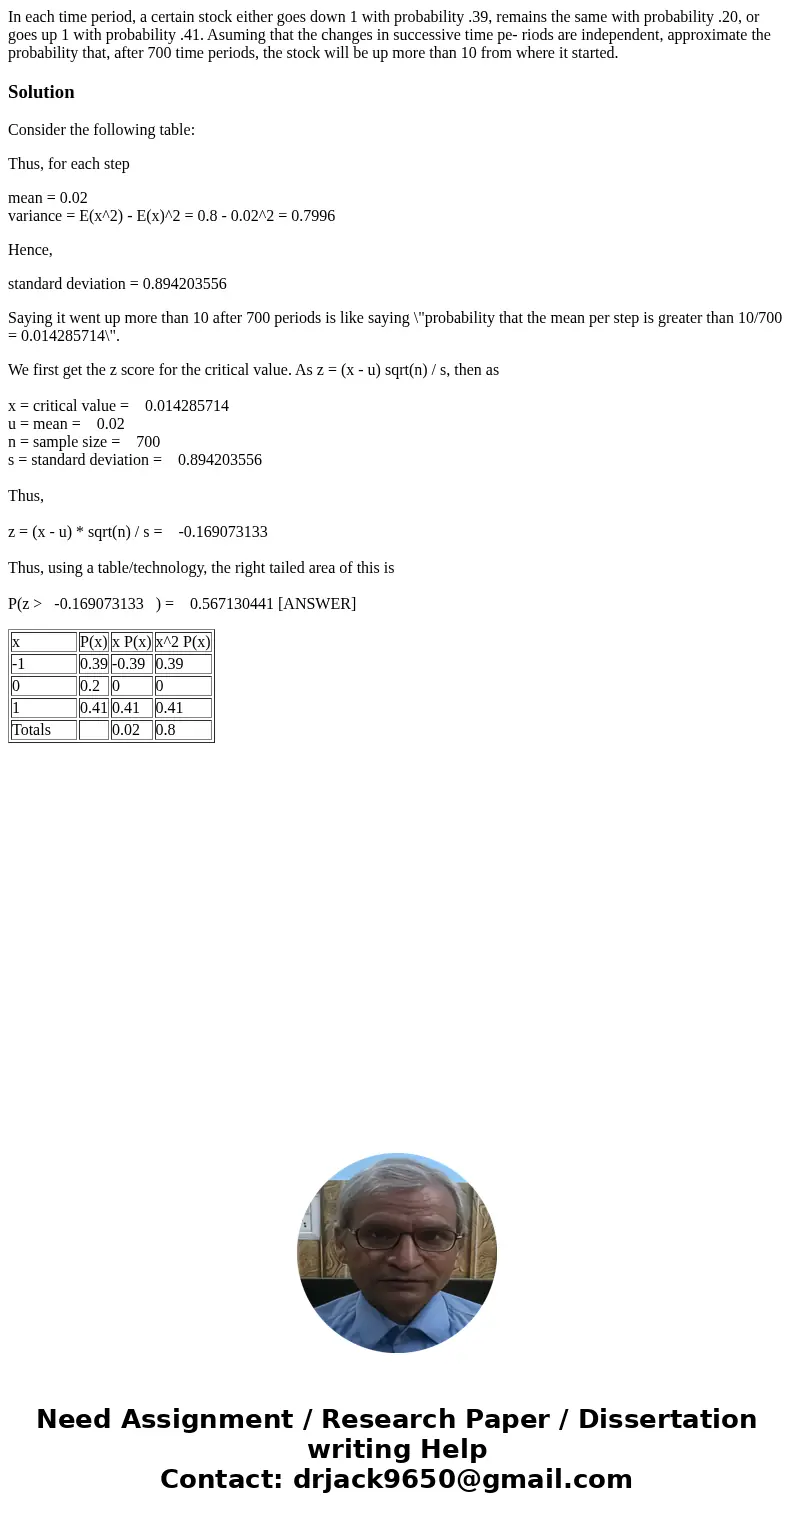
Consider the following table:
Thus, for each step
mean = 0.02
variance = E(x^2) - E(x)^2 = 0.8 - 0.02^2 = 0.7996
Hence,
standard deviation = 0.894203556
Saying it went up more than 10 after 700 periods is like saying \"probability that the mean per step is greater than 10/700 = 0.014285714\".
We first get the z score for the critical value. As z = (x - u) sqrt(n) / s, then as
x = critical value = 0.014285714
u = mean = 0.02
n = sample size = 700
s = standard deviation = 0.894203556
Thus,
z = (x - u) * sqrt(n) / s = -0.169073133
Thus, using a table/technology, the right tailed area of this is
P(z > -0.169073133 ) = 0.567130441 [ANSWER]
| x | P(x) | x P(x) | x^2 P(x) |
| -1 | 0.39 | -0.39 | 0.39 |
| 0 | 0.2 | 0 | 0 |
| 1 | 0.41 | 0.41 | 0.41 |
| Totals | 0.02 | 0.8 |

 Homework Sourse