1 Consider the following time series data Week Value 2 4 18
Solution
Sol)
1)
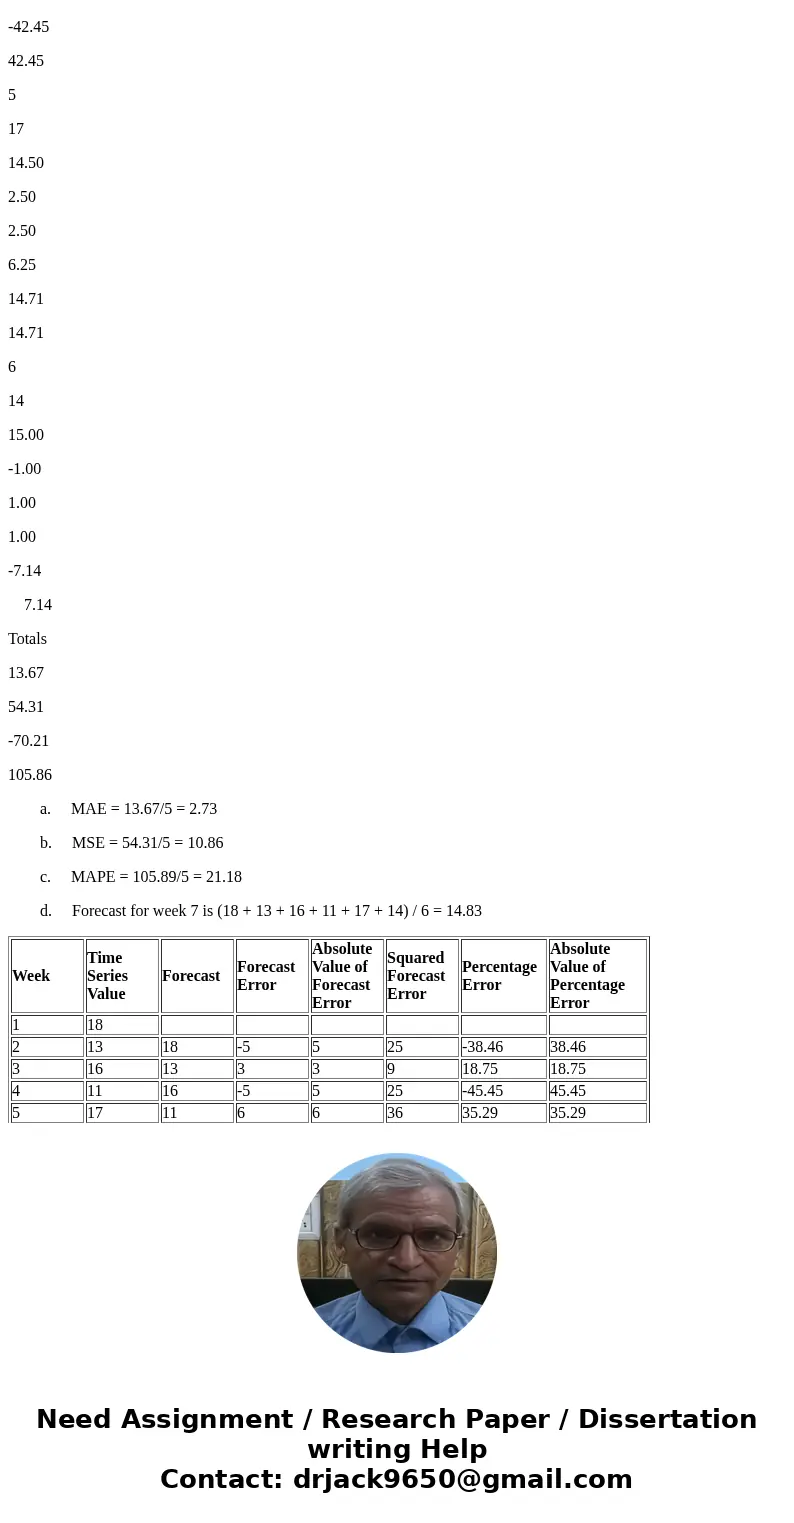
The following table shows the calculations for parts (a), (b), and (c).
Week
Time Series Value
Forecast
Forecast Error
Absolute Value of Forecast Error
Squared Forecast Error
Percentage Error
Absolute Value of Percentage Error
1
18
2
13
18
-5
5
25
-38.46
38.46
3
16
13
3
3
9
18.75
18.75
4
11
16
-5
5
25
-45.45
45.45
5
17
11
6
6
36
35.29
35.29
6
14
17
-3
3
9
-21.43
21.43
Totals
22
104
-51.30
159.38
a. MAE = 22/5 = 4.4
b. MSE = 104/5 = 20.8
c. MAPE = 159.38/5 = 31.88
d. Forecast for week 7 is 14
2)
Week
Time Series Value
Forecast
Forecast Error
Absolute Value of Forecast Error
Squared Forecast Error
Percentage Error
Absolute Value of Percentage Error
1
18
2
13
18.00
-5.00
5.00
25.00
-38.46
38.46
3
16
15.50
0.50
0.50
0.25
3.13
3.13
4
11
15.67
-4.67
4.67
21.81
-42.45
42.45
5
17
14.50
2.50
2.50
6.25
14.71
14.71
6
14
15.00
-1.00
1.00
1.00
-7.14
7.14
Totals
13.67
54.31
-70.21
105.86
a. MAE = 13.67/5 = 2.73
b. MSE = 54.31/5 = 10.86
c. MAPE = 105.89/5 = 21.18
d. Forecast for week 7 is (18 + 13 + 16 + 11 + 17 + 14) / 6 = 14.83
| Week | Time Series Value | Forecast | Forecast Error | Absolute Value of Forecast Error | Squared Forecast Error | Percentage Error | Absolute Value of Percentage Error |
| 1 | 18 | ||||||
| 2 | 13 | 18 | -5 | 5 | 25 | -38.46 | 38.46 |
| 3 | 16 | 13 | 3 | 3 | 9 | 18.75 | 18.75 |
| 4 | 11 | 16 | -5 | 5 | 25 | -45.45 | 45.45 |
| 5 | 17 | 11 | 6 | 6 | 36 | 35.29 | 35.29 |
| 6 | 14 | 17 | -3 | 3 | 9 | -21.43 | 21.43 |
| Totals | 22 | 104 | -51.30 | 159.38 |




 Homework Sourse