following data reps demand for items from the store over 14
following data reps demand for items from the store over 14 dayz. Split the data in to 2 equal parts of 7 days each. Assume F1 = 198.
Make spreadsheet using the first 7 days of demand to see the best exponential smoothing model for values of = 0.2, = 0.3, = 0.4. pick the model with the smallest absolute deviation for 7periods.
Make another spreadsheet using the holdout sample for the second 7 days to compare the best exponential smoothing model found in part a with a 3PMA three-period moving average model. Compare predictions on the basis of the total absolute deviation for the 7 periods.
What principles does this problem show?
| Day | Demand | Day | Demand |
|---|---|---|---|
| 1 | 200 | 8 | 208 |
| 2 | 209 | 9 | 186 |
| 3 | 215 | 10 | 193 |
| 4 | 180 | 11 | 197 |
| 5 | 190 | 12 | 188 |
| 6 | 195 | 13 | 191 |
| 7 | 200 | 14 | 196 |
Solution
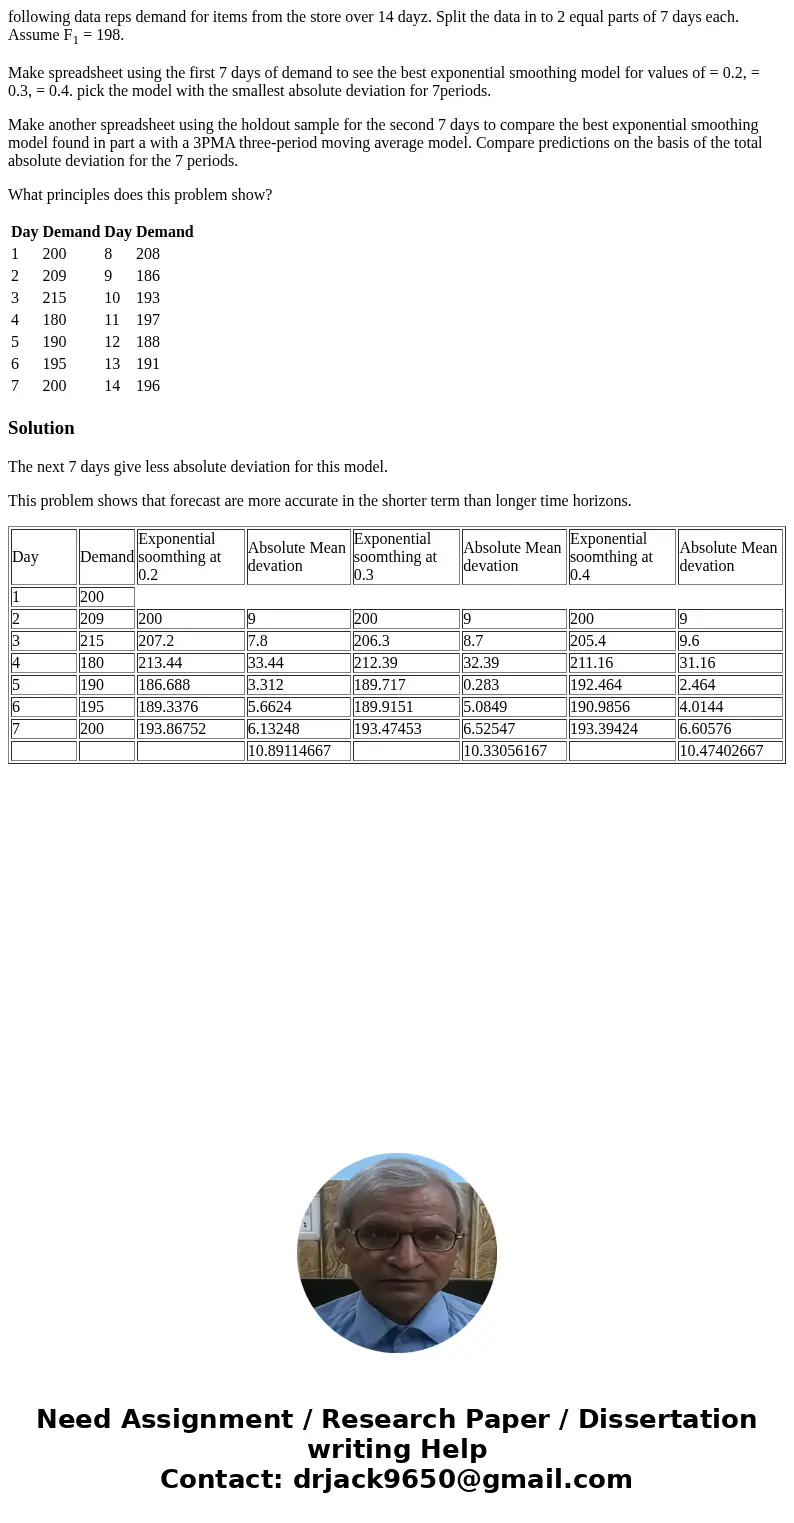
The next 7 days give less absolute deviation for this model.
This problem shows that forecast are more accurate in the shorter term than longer time horizons.
| Day | Demand | Exponential soomthing at 0.2 | Absolute Mean devation | Exponential soomthing at 0.3 | Absolute Mean devation | Exponential soomthing at 0.4 | Absolute Mean devation |
| 1 | 200 | ||||||
| 2 | 209 | 200 | 9 | 200 | 9 | 200 | 9 |
| 3 | 215 | 207.2 | 7.8 | 206.3 | 8.7 | 205.4 | 9.6 |
| 4 | 180 | 213.44 | 33.44 | 212.39 | 32.39 | 211.16 | 31.16 |
| 5 | 190 | 186.688 | 3.312 | 189.717 | 0.283 | 192.464 | 2.464 |
| 6 | 195 | 189.3376 | 5.6624 | 189.9151 | 5.0849 | 190.9856 | 4.0144 |
| 7 | 200 | 193.86752 | 6.13248 | 193.47453 | 6.52547 | 193.39424 | 6.60576 |
| 10.89114667 | 10.33056167 | 10.47402667 |

 Homework Sourse