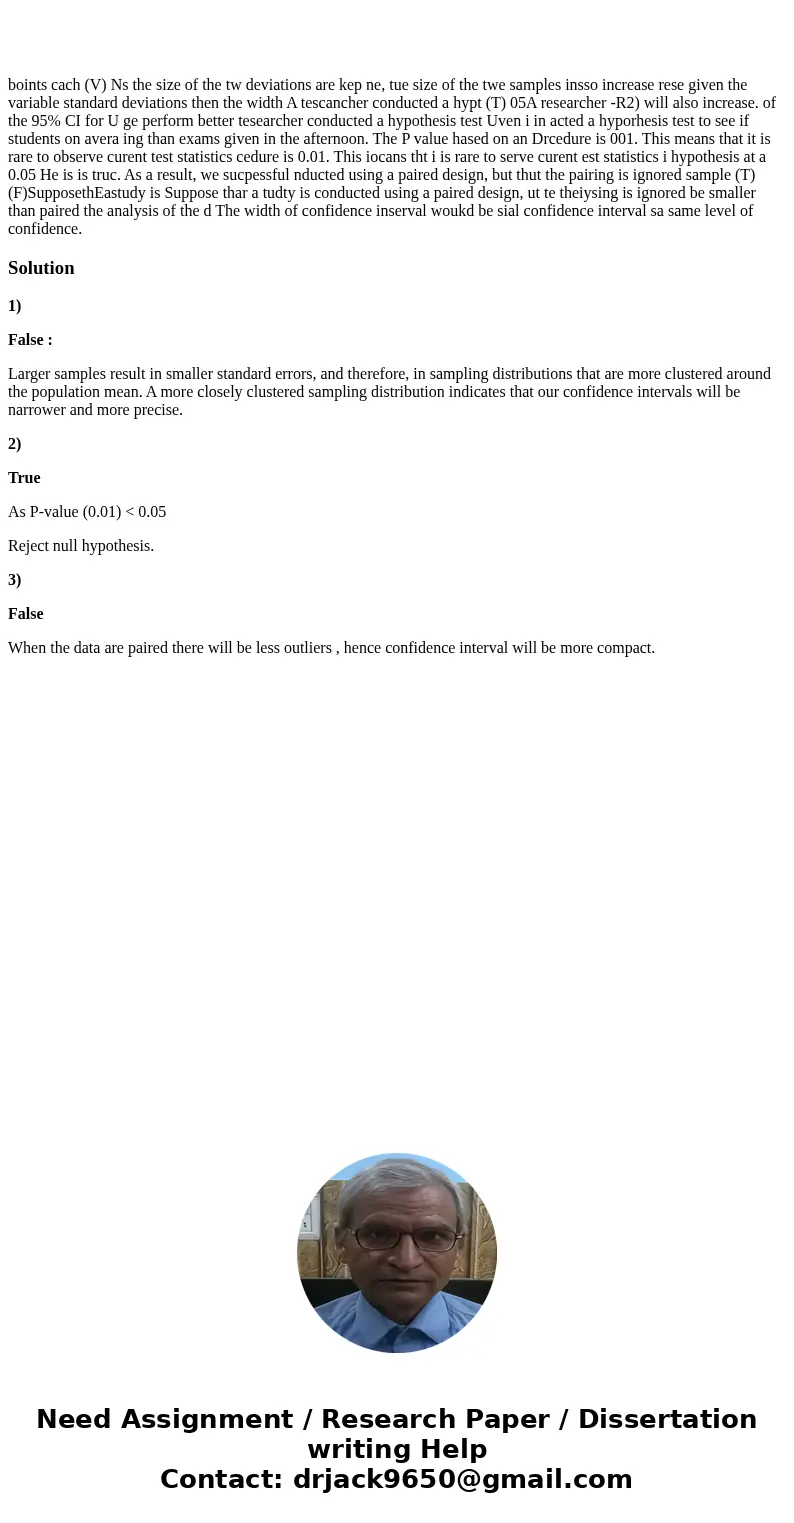
boints cach (V) Ns the size of the tw deviations are kep ne, tue size of the twe samples insso increase rese given the variable standard deviations then the width A tescancher conducted a hypt (T) 05A researcher -R2) will also increase. of the 95% CI for U ge perform better tesearcher conducted a hypothesis test Uven i in acted a hyporhesis test to see if students on avera ing than exams given in the afternoon. The P value hased on an Drcedure is 001. This means that it is rare to observe curent test statistics cedure is 0.01. This iocans tht i is rare to serve curent est statistics i hypothesis at a 0.05 He is is truc. As a result, we sucpessful nducted using a paired design, but thut the pairing is ignored sample (T)(F)SupposethEastudy is Suppose thar a tudty is conducted using a paired design, ut te theiysing is ignored be smaller than paired the analysis of the d The width of confidence inserval woukd be sial confidence interval sa same level of confidence.
1)
False :
Larger samples result in smaller standard errors, and therefore, in sampling distributions that are more clustered around the population mean. A more closely clustered sampling distribution indicates that our confidence intervals will be narrower and more precise.
2)
True
As P-value (0.01) < 0.05
Reject null hypothesis.
3)
False
When the data are paired there will be less outliers , hence confidence interval will be more compact.

 Homework Sourse