The effect of TGF beta on cancer cell lines was tested in th
The effect of TGF beta on cancer cell lines was tested in the following study: 9 cell lines were tested and each cell line was established in tubes. Each tube was treated with either TGF beta or an placebo solution. Each cell line was also treeated with VitC solution or placebo solution. The number of viable cells were counted after a fixed amount of time.
A. Disregarding the effect of the cell lines and VitC, is there any difference in cell counts with respect to TGF beta? Use at least two tests, one of which is nonparametric.
B. Disregarding the effects of VitC and TGF beta, are there any differences in the cell lines? Use at least two tests, one of which is nonparametric. If there are differences in the cell lines, test which are different and which are the same.
C. Considering all three factors, are there any differences? (do a 2 by 2 by 9 factorial design) The interactions are: TGFbeta*Vitc, TGFbeta*celline, VitC*cellines, TGFb*Vitc*celline
D. Compare the three analyses.
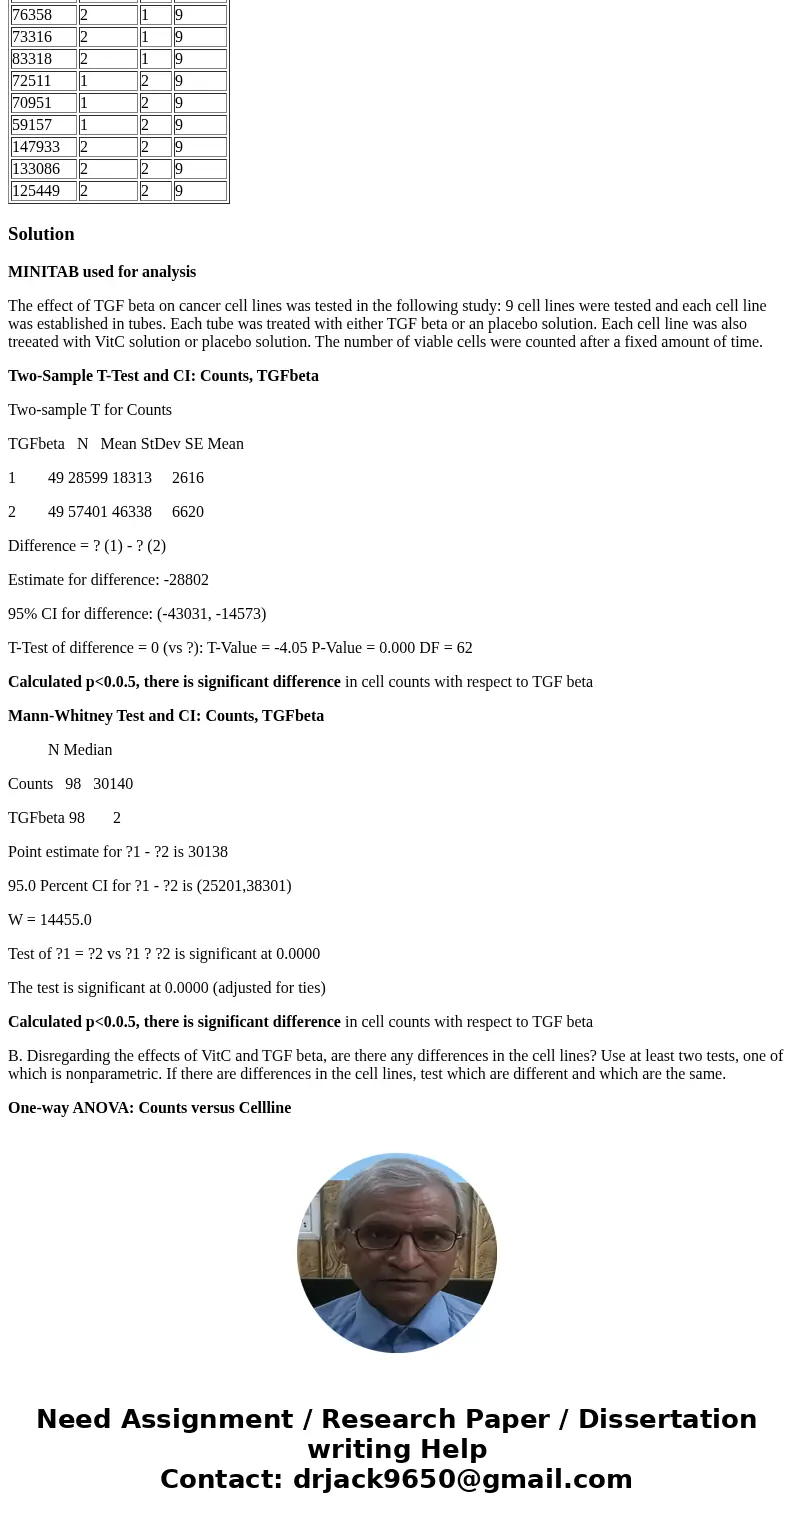
| Counts | TGFbeta | VitC | Cellline |
| 19838 | 1 | 1 | 1 |
| 16653 | 1 | 1 | 1 |
| 52621 | 2 | 1 | 1 |
| 57217 | 2 | 1 | 1 |
| 44842 | 1 | 2 | 1 |
| 39958 | 1 | 2 | 1 |
| 182719 | 2 | 2 | 1 |
| 200379 | 2 | 2 | 1 |
| 16347 | 1 | 1 | 2 |
| 16088 | 1 | 1 | 2 |
| 18225 | 2 | 1 | 2 |
| 19318 | 2 | 1 | 2 |
| 19902 | 1 | 2 | 2 |
| 75538 | 2 | 2 | 2 |
| 98421 | 2 | 2 | 2 |
| 13745 | 1 | 1 | 3 |
| 14773 | 1 | 1 | 3 |
| 12172 | 1 | 1 | 3 |
| 15892 | 2 | 1 | 3 |
| 21981 | 2 | 1 | 3 |
| 22342 | 2 | 1 | 3 |
| 47937 | 1 | 2 | 3 |
| 42340 | 1 | 2 | 3 |
| 57864 | 1 | 2 | 3 |
| 92182 | 2 | 2 | 3 |
| 70028 | 2 | 2 | 3 |
| 109130 | 2 | 2 | 3 |
| 12982 | 1 | 1 | 4 |
| 13073 | 1 | 1 | 4 |
| 11584 | 1 | 1 | 4 |
| 19886 | 2 | 1 | 4 |
| 23467 | 2 | 1 | 4 |
| 20949 | 2 | 1 | 4 |
| 25203 | 1 | 2 | 4 |
| 30312 | 1 | 2 | 4 |
| 30821 | 1 | 2 | 4 |
| 28586 | 2 | 2 | 4 |
| 26821 | 2 | 2 | 4 |
| 38302 | 2 | 2 | 4 |
| 6957 | 1 | 1 | 5 |
| 4862 | 1 | 1 | 5 |
| 3774 | 1 | 1 | 5 |
| 11050 | 2 | 1 | 5 |
| 10284 | 2 | 1 | 5 |
| 9630 | 2 | 1 | 5 |
| 3907 | 1 | 2 | 5 |
| 4585 | 1 | 2 | 5 |
| 3723 | 1 | 2 | 5 |
| 14219 | 2 | 2 | 5 |
| 10694 | 2 | 2 | 5 |
| 13059 | 2 | 2 | 5 |
| 30198 | 1 | 1 | 6 |
| 30485 | 1 | 1 | 6 |
| 21740 | 1 | 1 | 6 |
| 45020 | 2 | 1 | 6 |
| 45777 | 2 | 1 | 6 |
| 54269 | 2 | 1 | 6 |
| 43521 | 1 | 2 | 6 |
| 54407 | 1 | 2 | 6 |
| 45553 | 1 | 2 | 6 |
| 58827 | 2 | 2 | 6 |
| 79859 | 2 | 2 | 6 |
| 69110 | 2 | 2 | 6 |
| 11353 | 1 | 1 | 7 |
| 9919 | 1 | 1 | 7 |
| 12689 | 1 | 1 | 7 |
| 23702 | 2 | 1 | 7 |
| 19844 | 2 | 1 | 7 |
| 11259 | 2 | 1 | 7 |
| 31491 | 1 | 2 | 7 |
| 28313 | 1 | 2 | 7 |
| 30082 | 1 | 2 | 7 |
| 74621 | 2 | 2 | 7 |
| 59825 | 2 | 2 | 7 |
| 35405 | 1 | 1 | 8 |
| 27875 | 1 | 1 | 8 |
| 16565 | 1 | 1 | 8 |
| 18303 | 2 | 1 | 8 |
| 22170 | 2 | 1 | 8 |
| 27975 | 2 | 1 | 8 |
| 54626 | 1 | 2 | 8 |
| 56567 | 1 | 2 | 8 |
| 41519 | 1 | 2 | 8 |
| 102993 | 2 | 2 | 8 |
| 106772 | 2 | 2 | 8 |
| 89922 | 2 | 2 | 8 |
| 29690 | 1 | 1 | 9 |
| 32837 | 1 | 1 | 9 |
| 39654 | 1 | 1 | 9 |
| 76358 | 2 | 1 | 9 |
| 73316 | 2 | 1 | 9 |
| 83318 | 2 | 1 | 9 |
| 72511 | 1 | 2 | 9 |
| 70951 | 1 | 2 | 9 |
| 59157 | 1 | 2 | 9 |
| 147933 | 2 | 2 | 9 |
| 133086 | 2 | 2 | 9 |
| 125449 | 2 | 2 | 9 |
Solution
MINITAB used for analysis
The effect of TGF beta on cancer cell lines was tested in the following study: 9 cell lines were tested and each cell line was established in tubes. Each tube was treated with either TGF beta or an placebo solution. Each cell line was also treeated with VitC solution or placebo solution. The number of viable cells were counted after a fixed amount of time.
Two-Sample T-Test and CI: Counts, TGFbeta
Two-sample T for Counts
TGFbeta N Mean StDev SE Mean
1 49 28599 18313 2616
2 49 57401 46338 6620
Difference = ? (1) - ? (2)
Estimate for difference: -28802
95% CI for difference: (-43031, -14573)
T-Test of difference = 0 (vs ?): T-Value = -4.05 P-Value = 0.000 DF = 62
Calculated p<0.0.5, there is significant difference in cell counts with respect to TGF beta
Mann-Whitney Test and CI: Counts, TGFbeta
N Median
Counts 98 30140
TGFbeta 98 2
Point estimate for ?1 - ?2 is 30138
95.0 Percent CI for ?1 - ?2 is (25201,38301)
W = 14455.0
Test of ?1 = ?2 vs ?1 ? ?2 is significant at 0.0000
The test is significant at 0.0000 (adjusted for ties)
Calculated p<0.0.5, there is significant difference in cell counts with respect to TGF beta
B. Disregarding the effects of VitC and TGF beta, are there any differences in the cell lines? Use at least two tests, one of which is nonparametric. If there are differences in the cell lines, test which are different and which are the same.
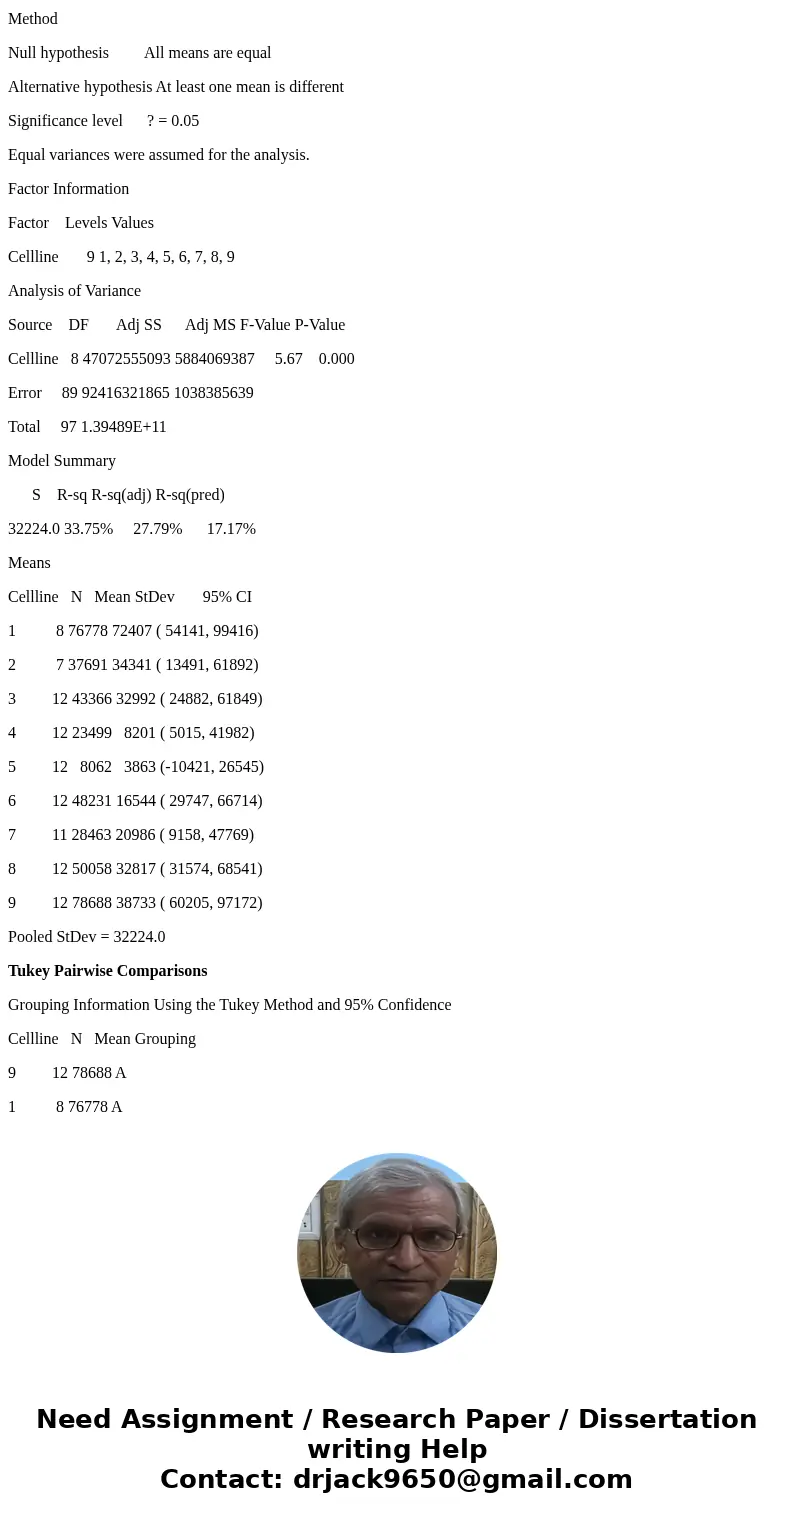
One-way ANOVA: Counts versus Cellline
Method
Null hypothesis All means are equal
Alternative hypothesis At least one mean is different
Significance level ? = 0.05
Equal variances were assumed for the analysis.
Factor Information
Factor Levels Values
Cellline 9 1, 2, 3, 4, 5, 6, 7, 8, 9
Analysis of Variance
Source DF Adj SS Adj MS F-Value P-Value
Cellline 8 47072555093 5884069387 5.67 0.000
Error 89 92416321865 1038385639
Total 97 1.39489E+11
Model Summary
S R-sq R-sq(adj) R-sq(pred)
32224.0 33.75% 27.79% 17.17%
Means
Cellline N Mean StDev 95% CI
1 8 76778 72407 ( 54141, 99416)
2 7 37691 34341 ( 13491, 61892)
3 12 43366 32992 ( 24882, 61849)
4 12 23499 8201 ( 5015, 41982)
5 12 8062 3863 (-10421, 26545)
6 12 48231 16544 ( 29747, 66714)
7 11 28463 20986 ( 9158, 47769)
8 12 50058 32817 ( 31574, 68541)
9 12 78688 38733 ( 60205, 97172)
Pooled StDev = 32224.0
Tukey Pairwise Comparisons
Grouping Information Using the Tukey Method and 95% Confidence
Cellline N Mean Grouping
9 12 78688 A
1 8 76778 A
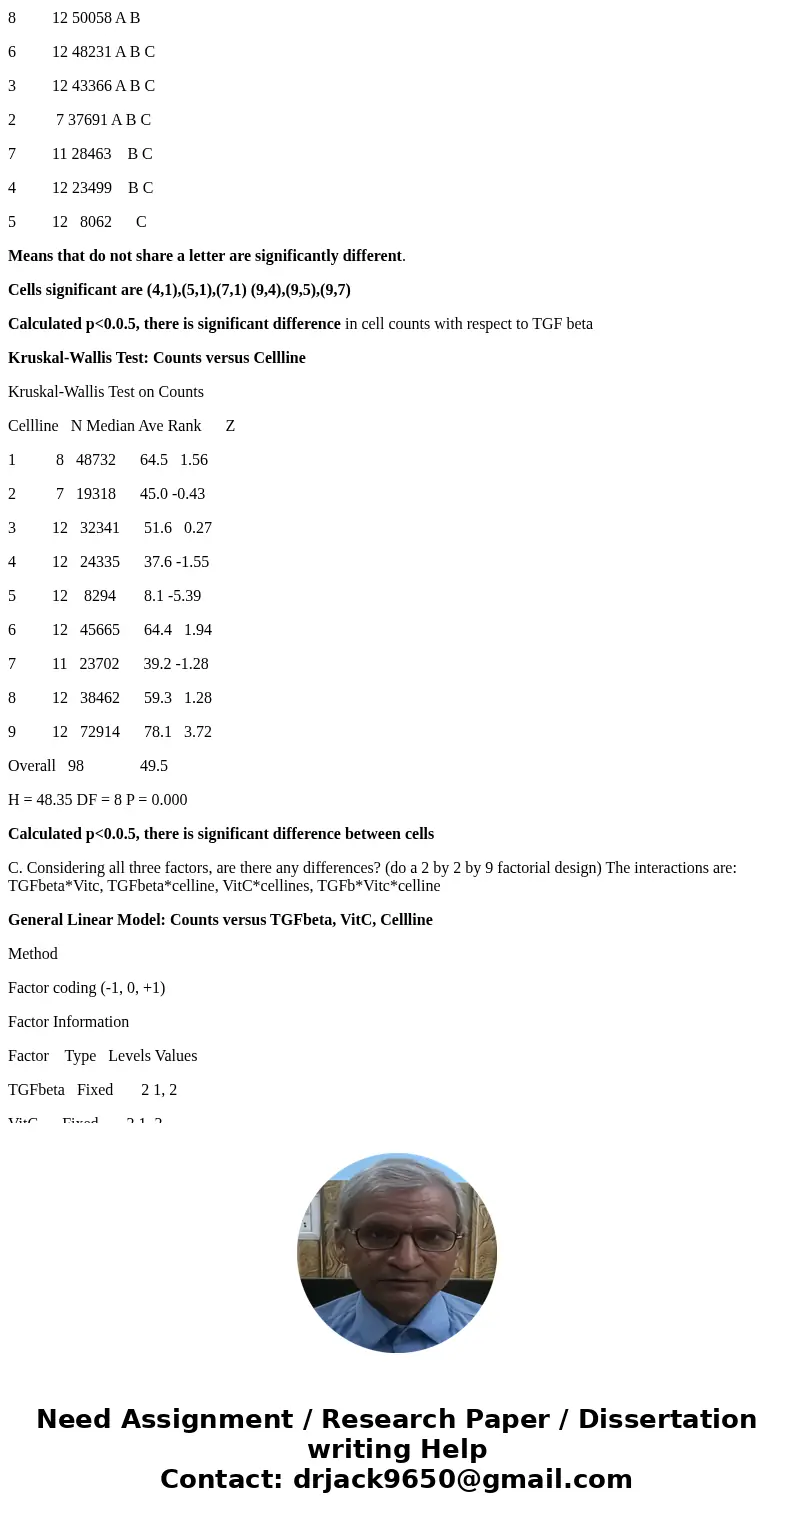
8 12 50058 A B
6 12 48231 A B C
3 12 43366 A B C
2 7 37691 A B C
7 11 28463 B C
4 12 23499 B C
5 12 8062 C
Means that do not share a letter are significantly different.
Cells significant are (4,1),(5,1),(7,1) (9,4),(9,5),(9,7)
Calculated p<0.0.5, there is significant difference in cell counts with respect to TGF beta
Kruskal-Wallis Test: Counts versus Cellline
Kruskal-Wallis Test on Counts
Cellline N Median Ave Rank Z
1 8 48732 64.5 1.56
2 7 19318 45.0 -0.43
3 12 32341 51.6 0.27
4 12 24335 37.6 -1.55
5 12 8294 8.1 -5.39
6 12 45665 64.4 1.94
7 11 23702 39.2 -1.28
8 12 38462 59.3 1.28
9 12 72914 78.1 3.72
Overall 98 49.5
H = 48.35 DF = 8 P = 0.000
Calculated p<0.0.5, there is significant difference between cells
C. Considering all three factors, are there any differences? (do a 2 by 2 by 9 factorial design) The interactions are: TGFbeta*Vitc, TGFbeta*celline, VitC*cellines, TGFb*Vitc*celline
General Linear Model: Counts versus TGFbeta, VitC, Cellline
Method
Factor coding (-1, 0, +1)
Factor Information
Factor Type Levels Values
TGFbeta Fixed 2 1, 2
VitC Fixed 2 1, 2
Cellline Fixed 9 1, 2, 3, 4, 5, 6, 7, 8, 9
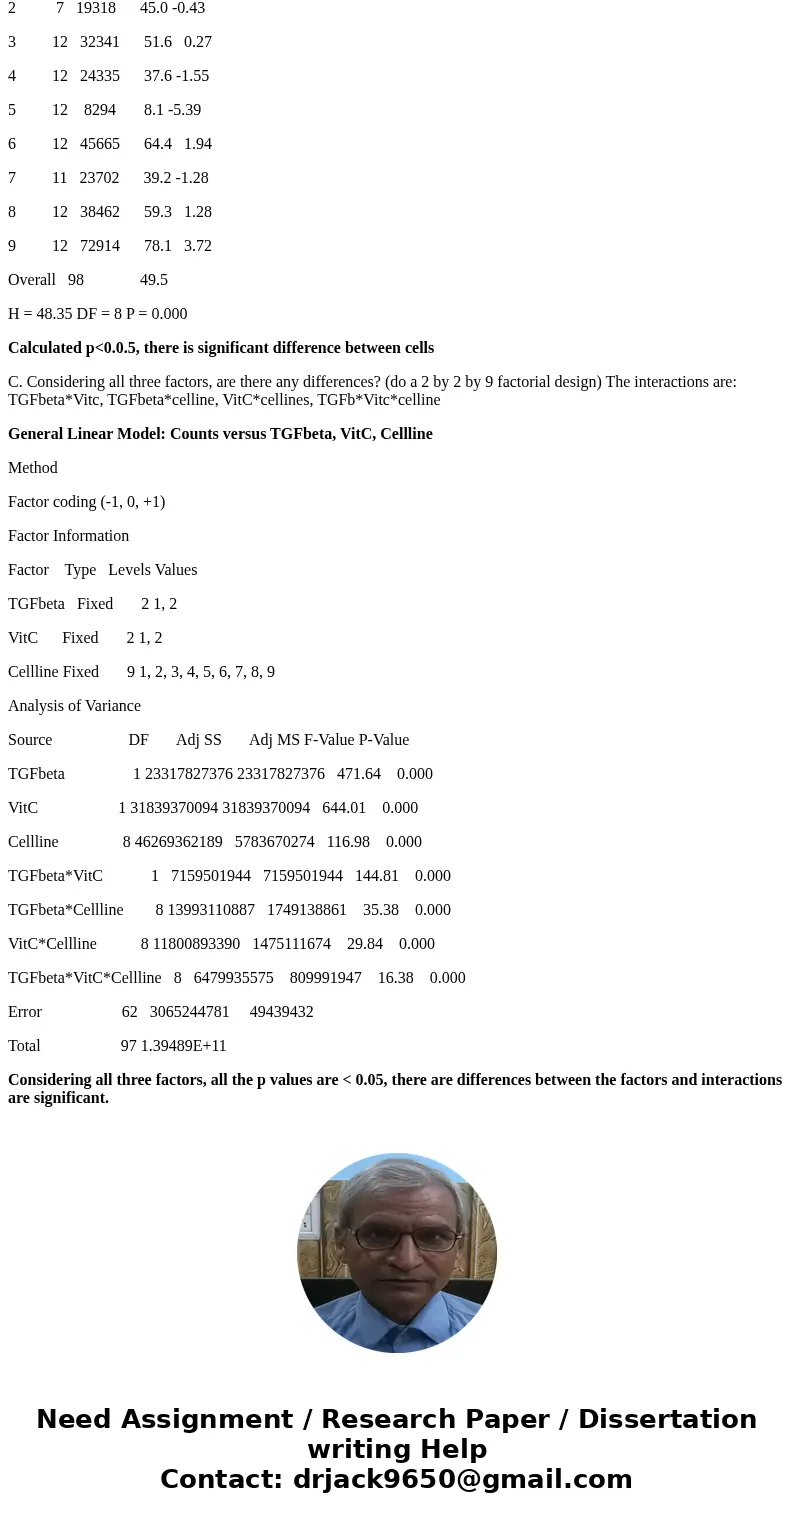
Analysis of Variance
Source DF Adj SS Adj MS F-Value P-Value
TGFbeta 1 23317827376 23317827376 471.64 0.000
VitC 1 31839370094 31839370094 644.01 0.000
Cellline 8 46269362189 5783670274 116.98 0.000
TGFbeta*VitC 1 7159501944 7159501944 144.81 0.000
TGFbeta*Cellline 8 13993110887 1749138861 35.38 0.000
VitC*Cellline 8 11800893390 1475111674 29.84 0.000
TGFbeta*VitC*Cellline 8 6479935575 809991947 16.38 0.000
Error 62 3065244781 49439432
Total 97 1.39489E+11
Considering all three factors, all the p values are < 0.05, there are differences between the factors and interactions are significant.


 Homework Sourse