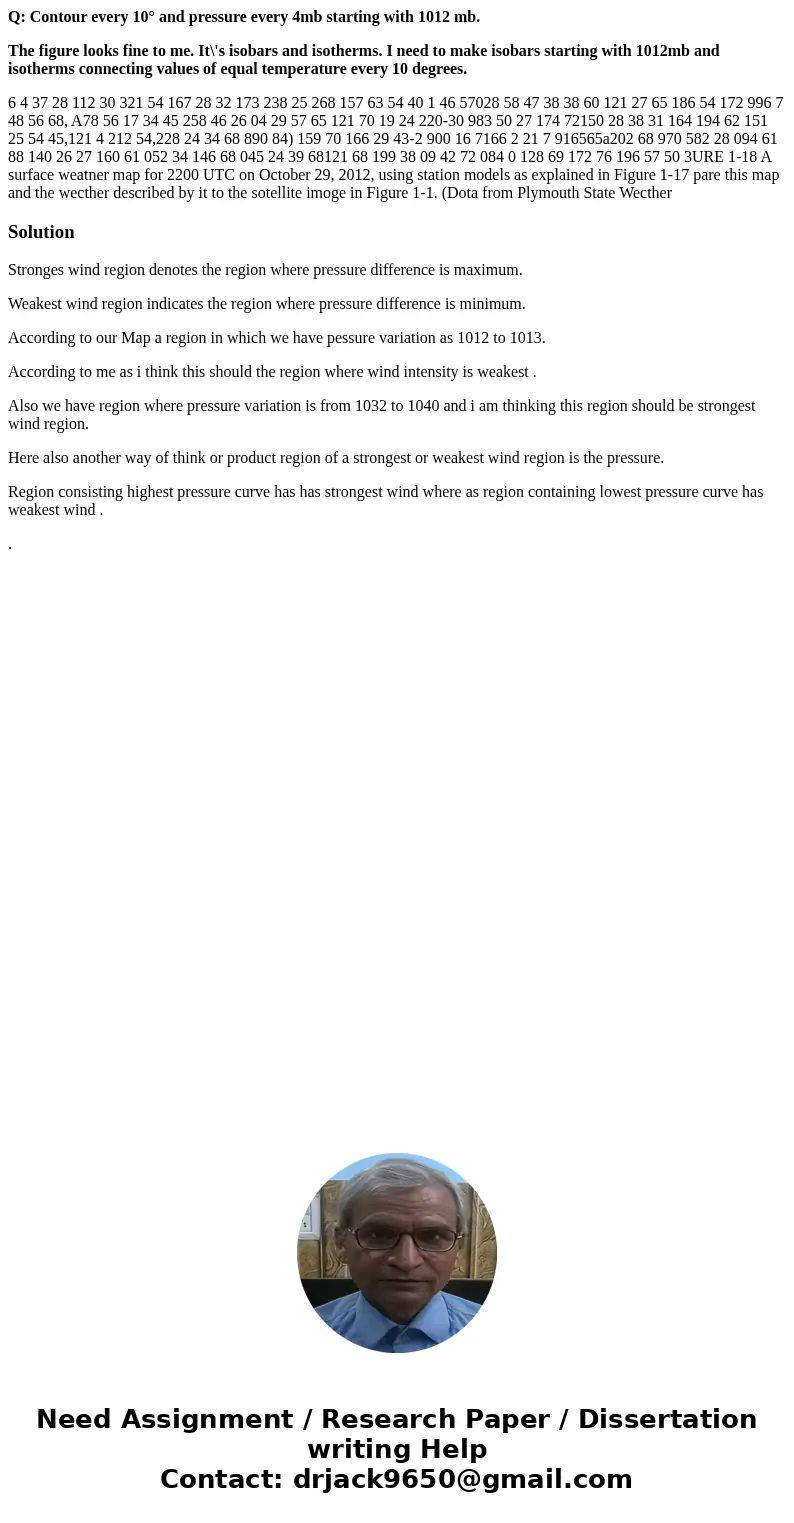
Q Contour every 10 and pressure every 4mb starting with 1012
Q: Contour every 10° and pressure every 4mb starting with 1012 mb.
The figure looks fine to me. It\'s isobars and isotherms. I need to make isobars starting with 1012mb and isotherms connecting values of equal temperature every 10 degrees.
6 4 37 28 112 30 321 54 167 28 32 173 238 25 268 157 63 54 40 1 46 57028 58 47 38 38 60 121 27 65 186 54 172 996 7 48 56 68, A78 56 17 34 45 258 46 26 04 29 57 65 121 70 19 24 220-30 983 50 27 174 72150 28 38 31 164 194 62 151 25 54 45,121 4 212 54,228 24 34 68 890 84) 159 70 166 29 43-2 900 16 7166 2 21 7 916565a202 68 970 582 28 094 61 88 140 26 27 160 61 052 34 146 68 045 24 39 68121 68 199 38 09 42 72 084 0 128 69 172 76 196 57 50 3URE 1-18 A surface weatner map for 2200 UTC on October 29, 2012, using station models as explained in Figure 1-17 pare this map and the wecther described by it to the sotellite imoge in Figure 1-1. (Dota from Plymouth State WectherSolution
Stronges wind region denotes the region where pressure difference is maximum.
Weakest wind region indicates the region where pressure difference is minimum.
According to our Map a region in which we have pessure variation as 1012 to 1013.
According to me as i think this should the region where wind intensity is weakest .
Also we have region where pressure variation is from 1032 to 1040 and i am thinking this region should be strongest wind region.
Here also another way of think or product region of a strongest or weakest wind region is the pressure.
Region consisting highest pressure curve has has strongest wind where as region containing lowest pressure curve has weakest wind .
.

 Homework Sourse