Using a graphing calculator to find the line of best fit for
Using a graphing calculator to find the line of best fit for the data below. Tell whether there is a strong correlation between the data: x (3,7,5,4,6,20,15,12) y (1,8,-1,5,10,18,20,-6)
I am checking my work against yours, please list all steps used. Thanks.
Solution
a. Line of best Fit
Mean of X = X / n = 9
Mean of Y = Y / n = 6.875
(Xi - Mean)^2 = 256
(Yi - Mean)^2 = 572.88
(Xi-Mean)*(Yi-Mean) = 227
b1 = (Xi-Mean)*(Yi-Mean) / (Xi - Mean)^2
b1 = 227 / 256 = 0.8867
bo = Y / n - b1 * X / n
bo = 6.875 - 0.8867*9 = -1.1055
Y = bo + b1 X
Y\'=-1.1055+0.8867*X
b. correlation between the data
r( X,Y) = Co V ( X,Y) / S.D (X) * S.D (y)
r( X,Y) = Sum(XY) / N- Mean of (X) * Mean of (Y) / Sqrt( X^2/n - ( Mean of X)^2 ) Sqrt( Y^2/n - ( Mean of Y)^2 )
Co v ( X, Y ) = 1 /8 (722) - [ 1/8 *72 ] [ 1/8 *55] = 28.375
S. D ( X ) = Sqrt( 1/8*904-(1/8*72)^2) 5.657
S .D (Y) = Sqrt( 1/8*951-(1/8*55)^2) 8.462
r(x,y) = 28.375 / 5.657*8.462 = 0.5928
If r = 0.5928> 0 ,Perfect Positive Correlation
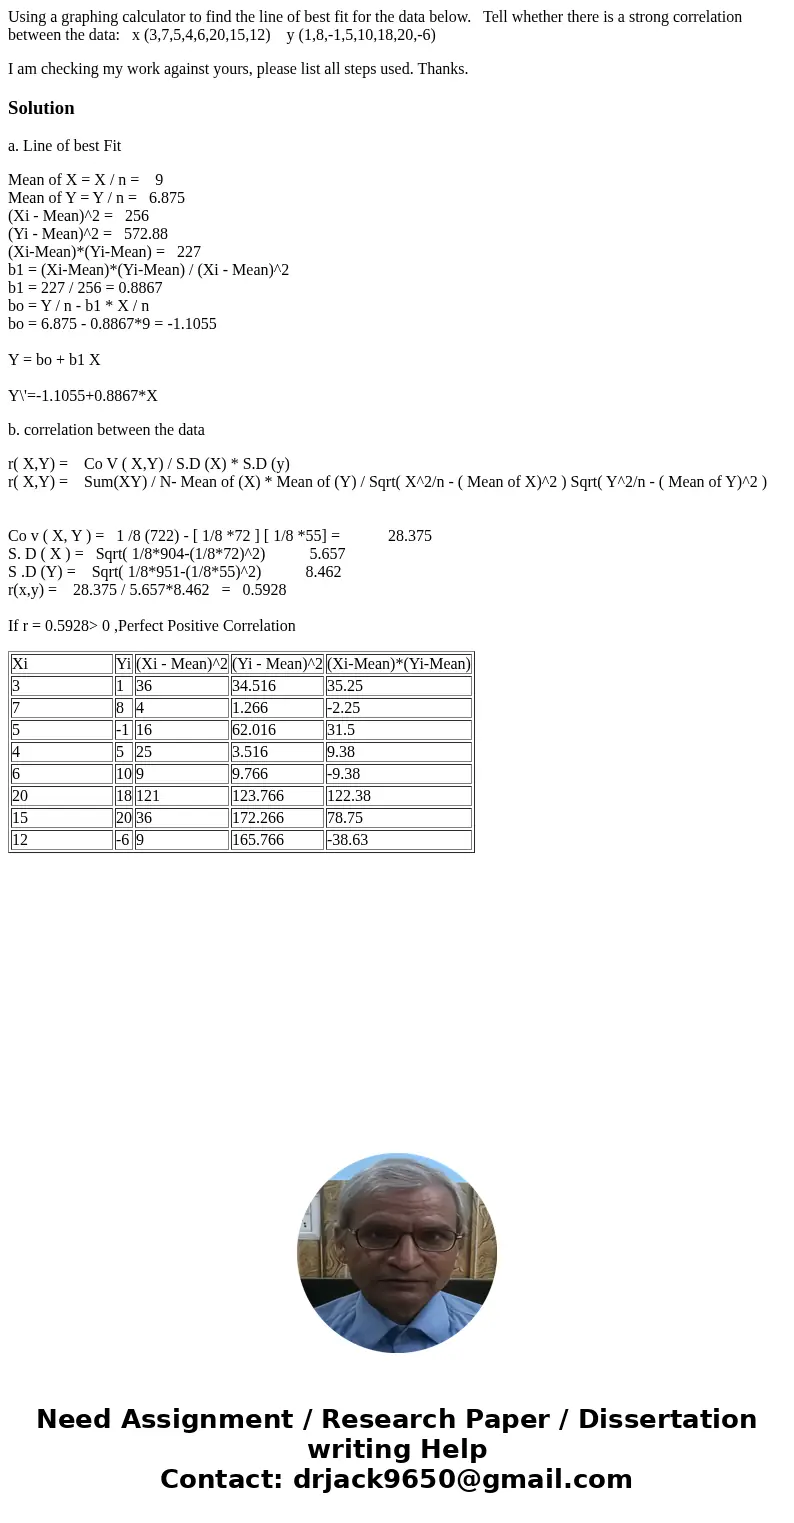
| Xi | Yi | (Xi - Mean)^2 | (Yi - Mean)^2 | (Xi-Mean)*(Yi-Mean) |
| 3 | 1 | 36 | 34.516 | 35.25 |
| 7 | 8 | 4 | 1.266 | -2.25 |
| 5 | -1 | 16 | 62.016 | 31.5 |
| 4 | 5 | 25 | 3.516 | 9.38 |
| 6 | 10 | 9 | 9.766 | -9.38 |
| 20 | 18 | 121 | 123.766 | 122.38 |
| 15 | 20 | 36 | 172.266 | 78.75 |
| 12 | -6 | 9 | 165.766 | -38.63 |

 Homework Sourse