A car insurance company conducted a survey to find out how m
A car insurance company conducted a survey to find out how many car accidents people had been
involved in. They selected a sample of 32 adults between the ages of 30 and 70 and asked each person how
many accidents they had been involved in the past ten years. The following data were obtained.
0 1 0 3 2 1 0 2
1 1 1 0 2 0 4 1
2 0 0 1 0 2 1 3
1 3 0 0 1 0 5 4
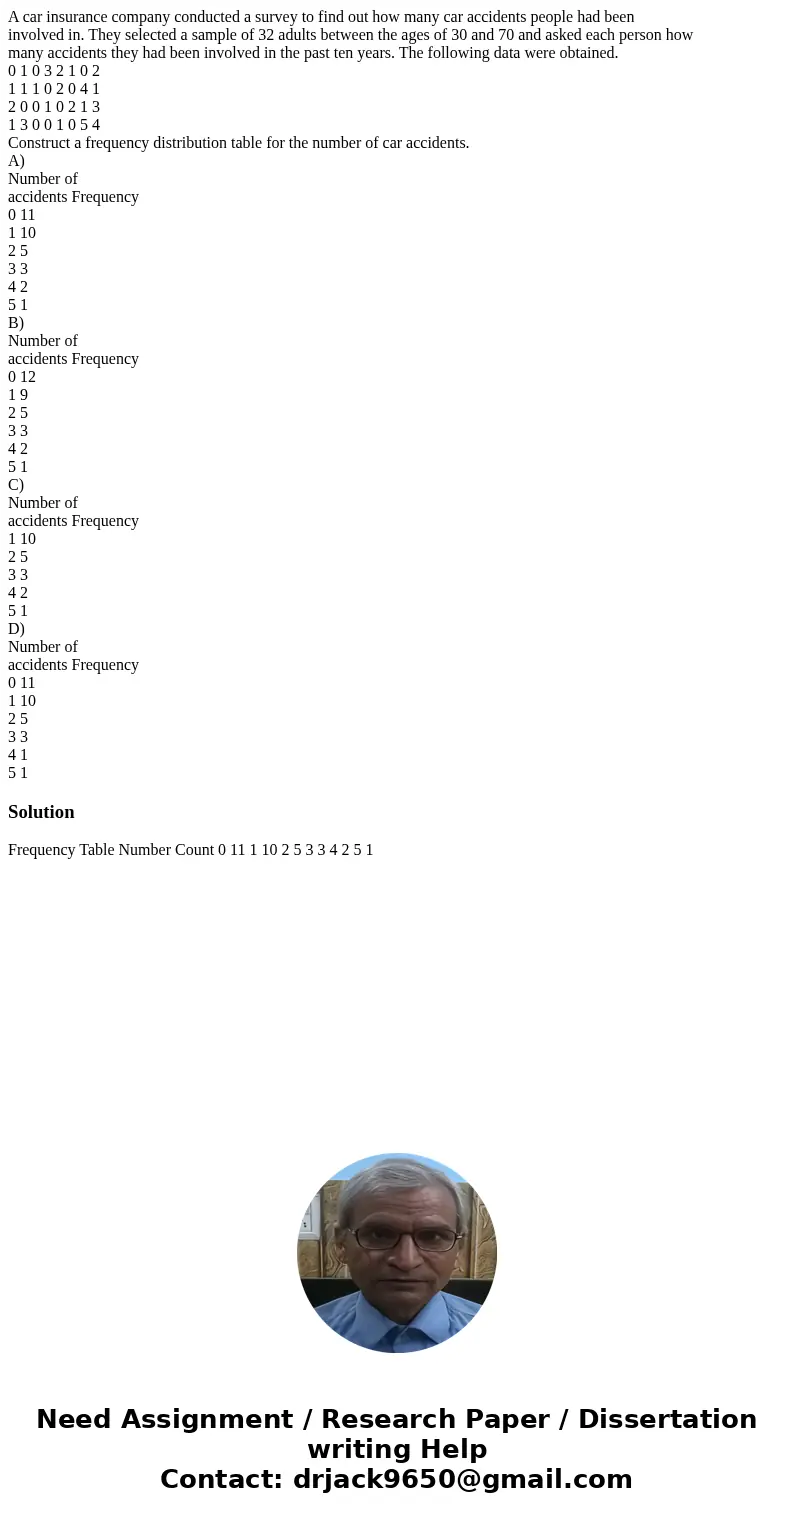
Construct a frequency distribution table for the number of car accidents.
A)
Number of
accidents Frequency
0 11
1 10
2 5
3 3
4 2
5 1
B)
Number of
accidents Frequency
0 12
1 9
2 5
3 3
4 2
5 1
C)
Number of
accidents Frequency
1 10
2 5
3 3
4 2
5 1
D)
Number of
accidents Frequency
0 11
1 10
2 5
3 3
4 1
5 1
Solution
Frequency Table Number Count 0 11 1 10 2 5 3 3 4 2 5 1
 Homework Sourse