3 If we had a tabulation of the errors then if we then squar
3. If we had a tabulation of the errors, then if we then squared and summed them they would
equal ___.
a. 0
b. 794
c. 7,940
d. 446,174
e. 438,234
4. The variation of Y explained by X1, X2, X3, and X4 is approximately
a. 40%
b. 98%
c. 28%
d. 71%
e. None of these or unable to determine
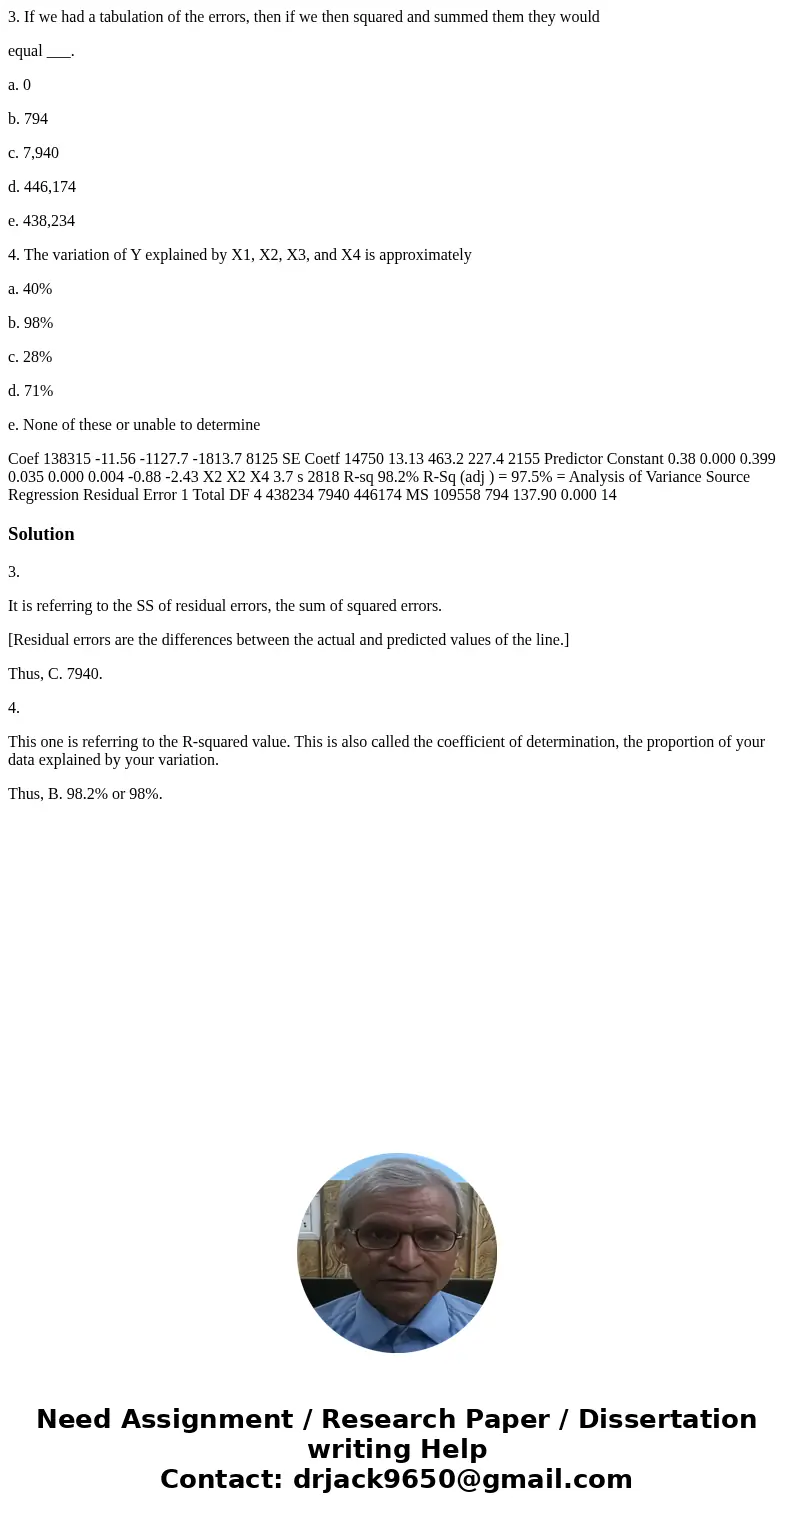
Coef 138315 -11.56 -1127.7 -1813.7 8125 SE Coetf 14750 13.13 463.2 227.4 2155 Predictor Constant 0.38 0.000 0.399 0.035 0.000 0.004 -0.88 -2.43 X2 X2 X4 3.7 s 2818 R-sq 98.2% R-Sq (adj ) = 97.5% = Analysis of Variance Source Regression Residual Error 1 Total DF 4 438234 7940 446174 MS 109558 794 137.90 0.000 14Solution
3.
It is referring to the SS of residual errors, the sum of squared errors.
[Residual errors are the differences between the actual and predicted values of the line.]
Thus, C. 7940.
4.
This one is referring to the R-squared value. This is also called the coefficient of determination, the proportion of your data explained by your variation.
Thus, B. 98.2% or 98%.

 Homework Sourse