home study questions and answers math statistics and pro
home / study / questions and answers / math / statistics and probability / the data in the following table resulted from an ...
Question
The data in the following table resulted from an experiment that utilized a completely randomized design:
Trtmnt 1 Tment 2 Trtmnt 3
3.8 5.4 1.3
1.2 2.0 0.7
4.1 4.8 2.2
5.5 3.8
2.3
a. Use statistical software (or formulas) to complete the following ANOVA table:
Source df SS MS F
Treatments
Error
Total
b. Test the null hypothesis that mu1=mu2=mu3, where mui represents the true mean for treatment i, against the alternative that at least two of the means differ. Use a=.01.
Solution
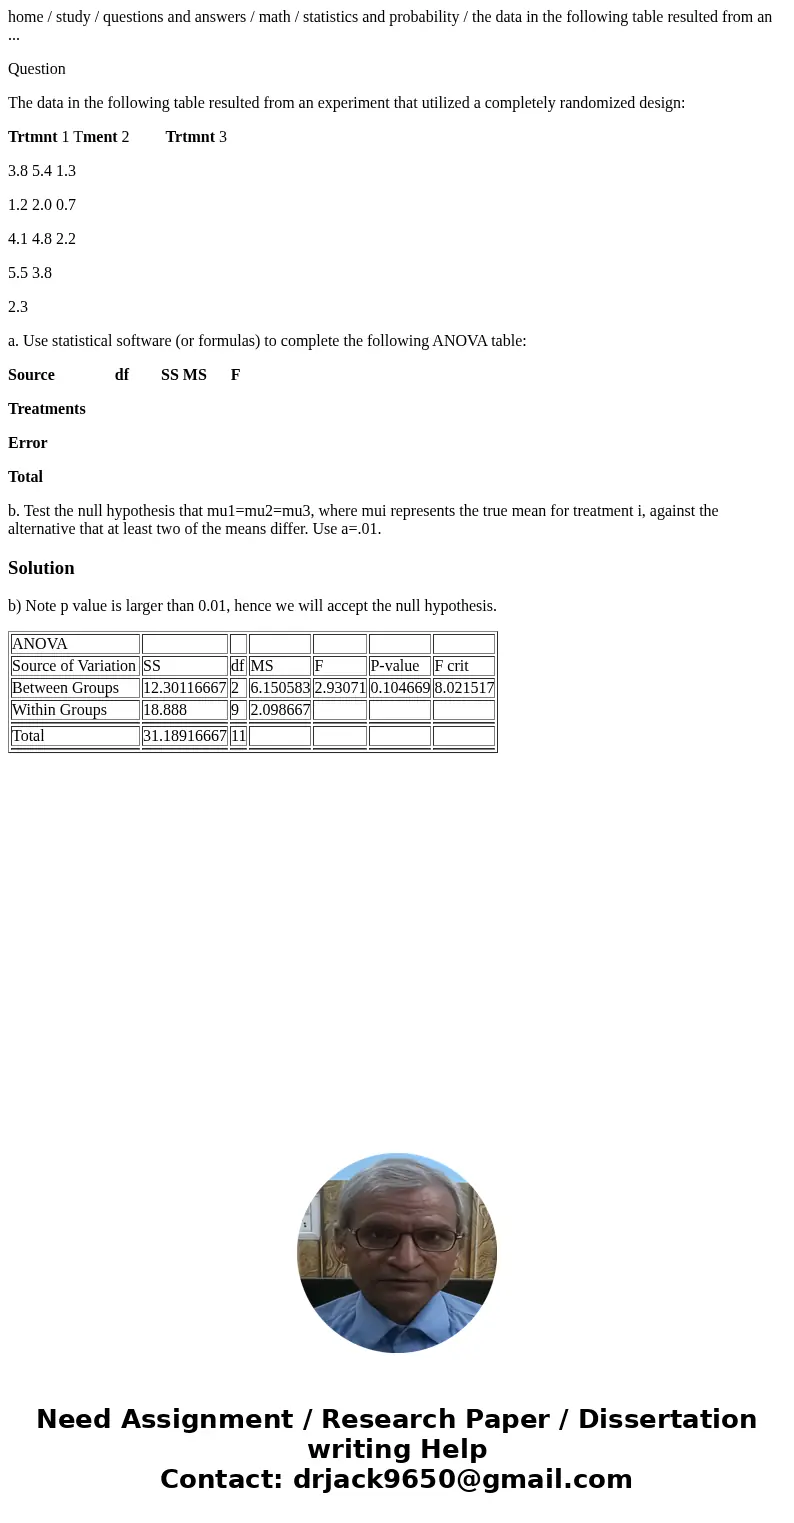
b) Note p value is larger than 0.01, hence we will accept the null hypothesis.
| ANOVA | ||||||
| Source of Variation | SS | df | MS | F | P-value | F crit |
| Between Groups | 12.30116667 | 2 | 6.150583 | 2.93071 | 0.104669 | 8.021517 |
| Within Groups | 18.888 | 9 | 2.098667 | |||
| Total | 31.18916667 | 11 | ||||

 Homework Sourse