Genetics Co Dominance Problem Im having a hard time understa
Genetics Co- Dominance Problem
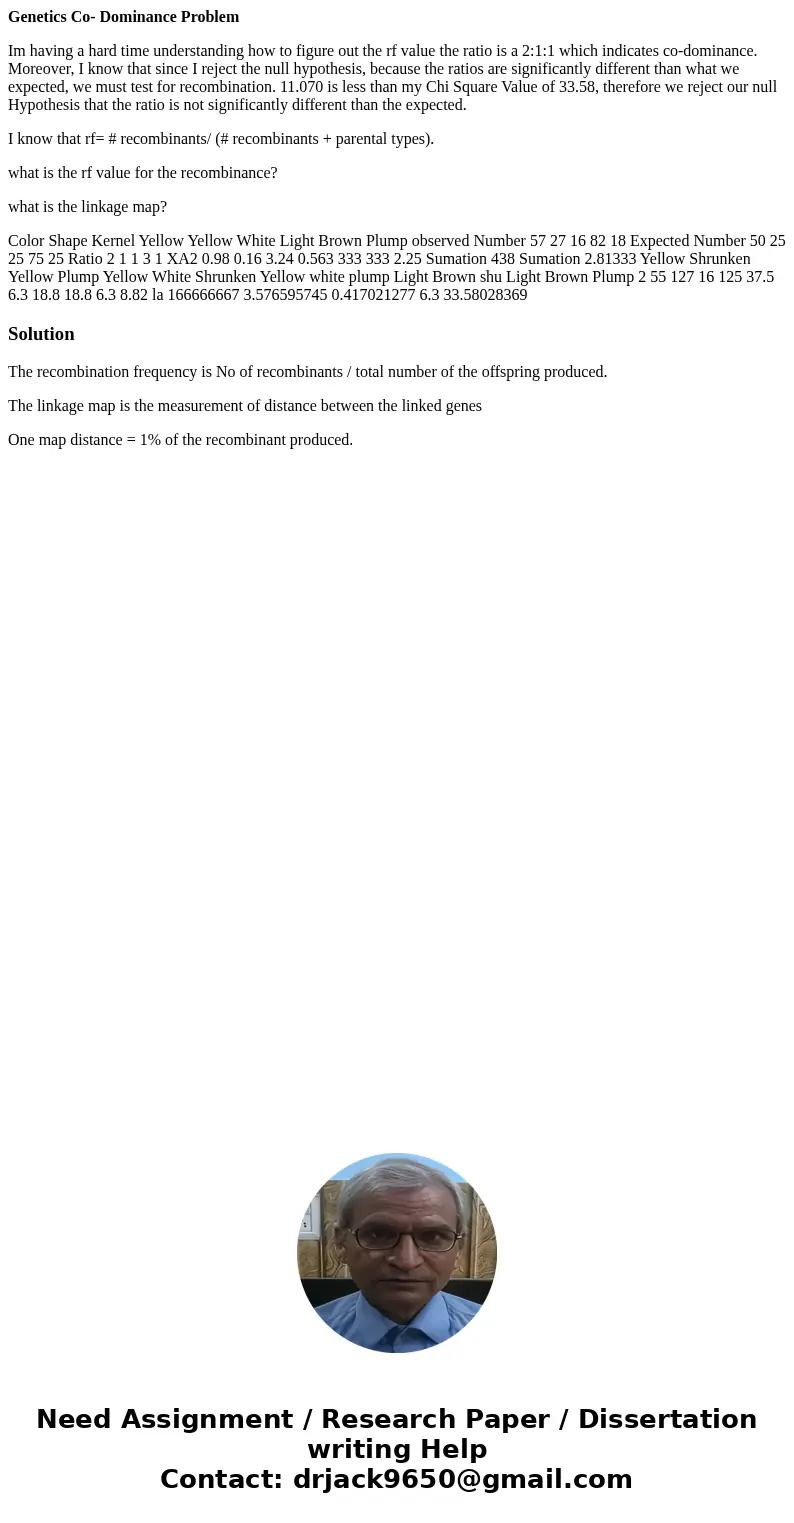
Im having a hard time understanding how to figure out the rf value the ratio is a 2:1:1 which indicates co-dominance. Moreover, I know that since I reject the null hypothesis, because the ratios are significantly different than what we expected, we must test for recombination. 11.070 is less than my Chi Square Value of 33.58, therefore we reject our null Hypothesis that the ratio is not significantly different than the expected.
I know that rf= # recombinants/ (# recombinants + parental types).
what is the rf value for the recombinance?
what is the linkage map?
Color Shape Kernel Yellow Yellow White Light Brown Plump observed Number 57 27 16 82 18 Expected Number 50 25 25 75 25 Ratio 2 1 1 3 1 XA2 0.98 0.16 3.24 0.563 333 333 2.25 Sumation 438 Sumation 2.81333 Yellow Shrunken Yellow Plump Yellow White Shrunken Yellow white plump Light Brown shu Light Brown Plump 2 55 127 16 125 37.5 6.3 18.8 18.8 6.3 8.82 la 166666667 3.576595745 0.417021277 6.3 33.58028369Solution
The recombination frequency is No of recombinants / total number of the offspring produced.
The linkage map is the measurement of distance between the linked genes
One map distance = 1% of the recombinant produced.

 Homework Sourse