Stem and Leaf Plot of Actresses Ages 2 2 5 6 8 9 9 3 0 0 2 3
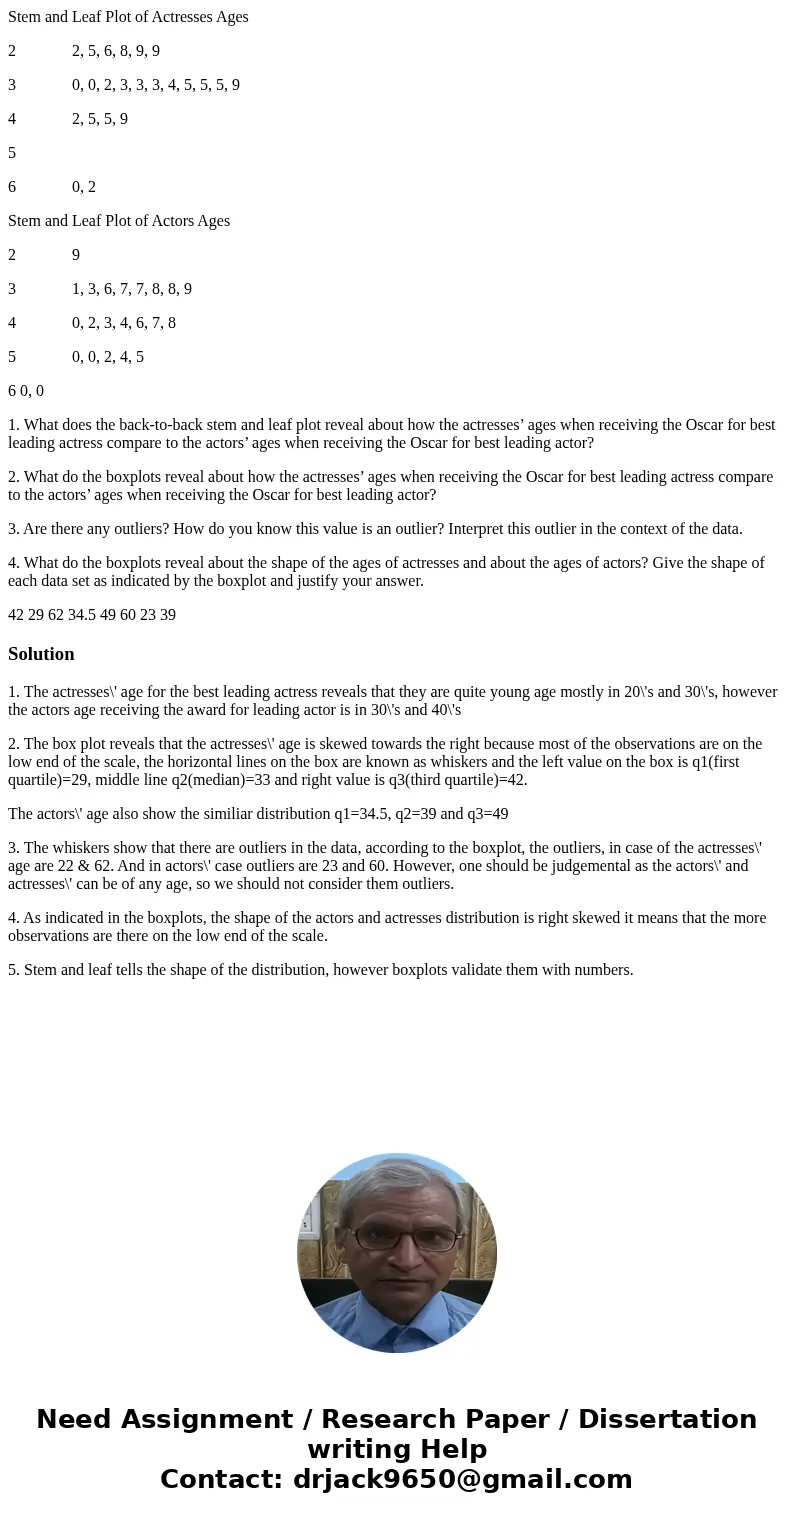
Stem and Leaf Plot of Actresses Ages
2 2, 5, 6, 8, 9, 9
3 0, 0, 2, 3, 3, 3, 4, 5, 5, 5, 9
4 2, 5, 5, 9
5
6 0, 2
Stem and Leaf Plot of Actors Ages
2 9
3 1, 3, 6, 7, 7, 8, 8, 9
4 0, 2, 3, 4, 6, 7, 8
5 0, 0, 2, 4, 5
6 0, 0
1. What does the back-to-back stem and leaf plot reveal about how the actresses’ ages when receiving the Oscar for best leading actress compare to the actors’ ages when receiving the Oscar for best leading actor?
2. What do the boxplots reveal about how the actresses’ ages when receiving the Oscar for best leading actress compare to the actors’ ages when receiving the Oscar for best leading actor?
3. Are there any outliers? How do you know this value is an outlier? Interpret this outlier in the context of the data.
4. What do the boxplots reveal about the shape of the ages of actresses and about the ages of actors? Give the shape of each data set as indicated by the boxplot and justify your answer.
42 29 62 34.5 49 60 23 39Solution
1. The actresses\' age for the best leading actress reveals that they are quite young age mostly in 20\'s and 30\'s, however the actors age receiving the award for leading actor is in 30\'s and 40\'s
2. The box plot reveals that the actresses\' age is skewed towards the right because most of the observations are on the low end of the scale, the horizontal lines on the box are known as whiskers and the left value on the box is q1(first quartile)=29, middle line q2(median)=33 and right value is q3(third quartile)=42.
The actors\' age also show the similiar distribution q1=34.5, q2=39 and q3=49
3. The whiskers show that there are outliers in the data, according to the boxplot, the outliers, in case of the actresses\' age are 22 & 62. And in actors\' case outliers are 23 and 60. However, one should be judgemental as the actors\' and actresses\' can be of any age, so we should not consider them outliers.
4. As indicated in the boxplots, the shape of the actors and actresses distribution is right skewed it means that the more observations are there on the low end of the scale.
5. Stem and leaf tells the shape of the distribution, however boxplots validate them with numbers.

 Homework Sourse