Copy of Consider the table above that shows prices and quant
Copy of
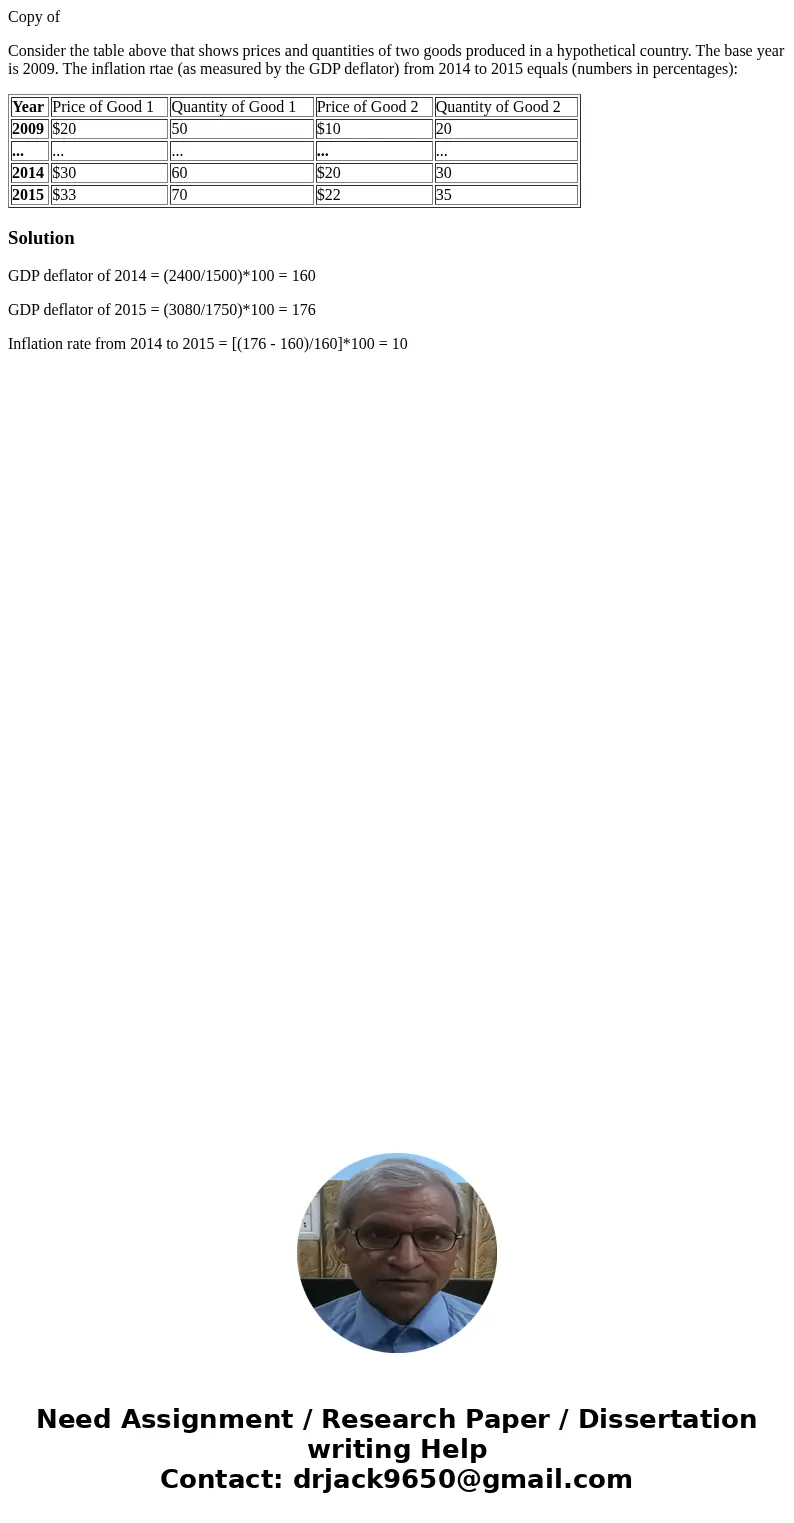
Consider the table above that shows prices and quantities of two goods produced in a hypothetical country. The base year is 2009. The inflation rtae (as measured by the GDP deflator) from 2014 to 2015 equals (numbers in percentages):
| Year | Price of Good 1 | Quantity of Good 1 | Price of Good 2 | Quantity of Good 2 |
| 2009 | $20 | 50 | $10 | 20 |
| ... | ... | ... | ... | ... |
| 2014 | $30 | 60 | $20 | 30 |
| 2015 | $33 | 70 | $22 | 35 |
Solution
GDP deflator of 2014 = (2400/1500)*100 = 160
GDP deflator of 2015 = (3080/1750)*100 = 176
Inflation rate from 2014 to 2015 = [(176 - 160)/160]*100 = 10

 Homework Sourse