The table shows the quarterly demands of year 2013 and year
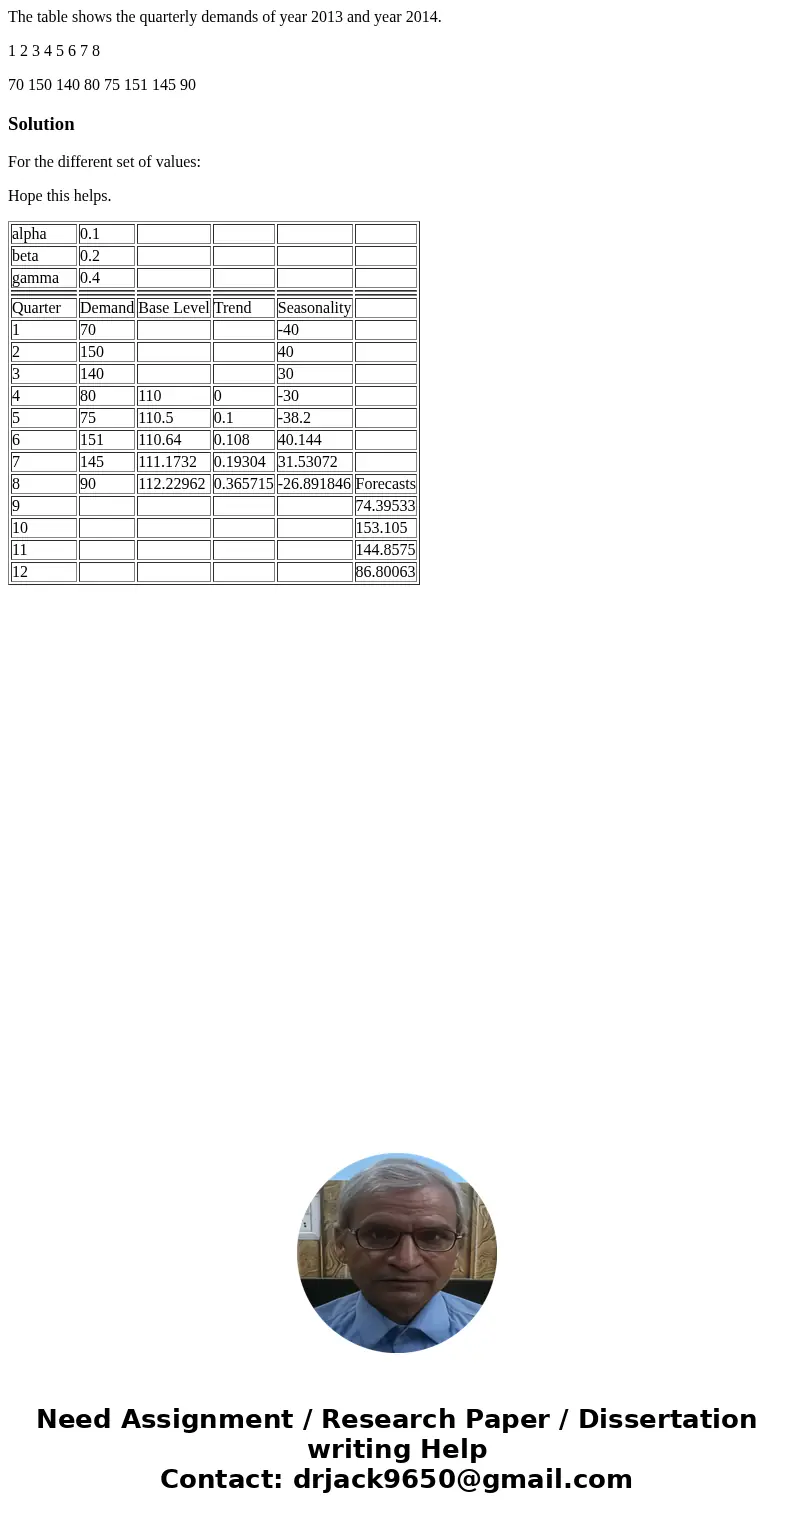
The table shows the quarterly demands of year 2013 and year 2014.
1 2 3 4 5 6 7 8
70 150 140 80 75 151 145 90
Solution
For the different set of values:
Hope this helps.
| alpha | 0.1 | ||||
| beta | 0.2 | ||||
| gamma | 0.4 | ||||
| Quarter | Demand | Base Level | Trend | Seasonality | |
| 1 | 70 | -40 | |||
| 2 | 150 | 40 | |||
| 3 | 140 | 30 | |||
| 4 | 80 | 110 | 0 | -30 | |
| 5 | 75 | 110.5 | 0.1 | -38.2 | |
| 6 | 151 | 110.64 | 0.108 | 40.144 | |
| 7 | 145 | 111.1732 | 0.19304 | 31.53072 | |
| 8 | 90 | 112.22962 | 0.365715 | -26.891846 | Forecasts |
| 9 | 74.39533 | ||||
| 10 | 153.105 | ||||
| 11 | 144.8575 | ||||
| 12 | 86.80063 |

 Homework Sourse