Instructions Full work must be shown for each example or no
Instructions: Full work must be shown for each example or no credit will be awarded. Explain each result that you provide. Keep your solutions neat and do your best to conform to the format of the exam. The answer to each question should be typed right after the specific question and for full credit it should be complete and correct.
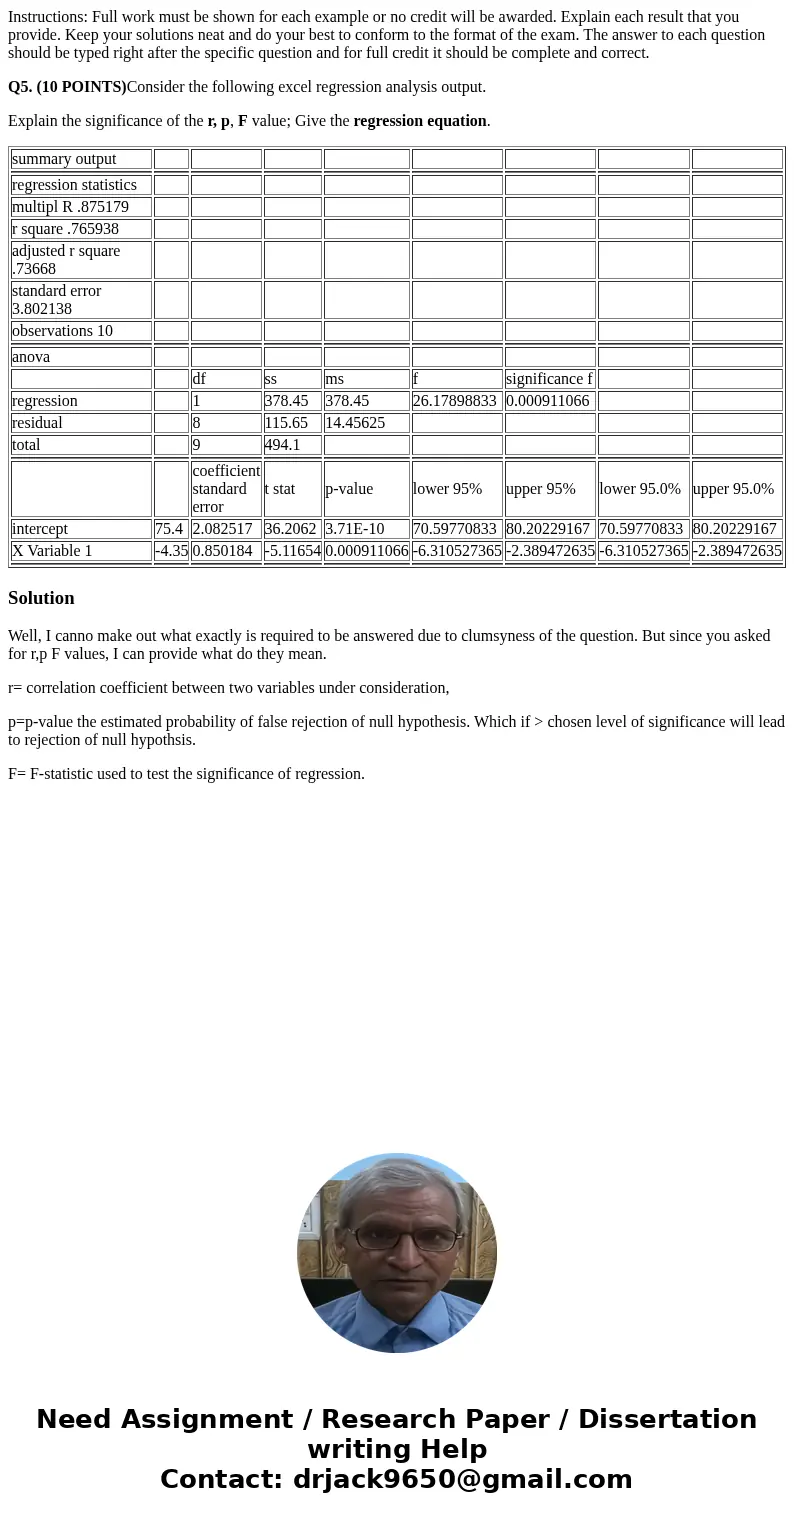
Q5. (10 POINTS)Consider the following excel regression analysis output.
Explain the significance of the r, p, F value; Give the regression equation.
| summary output | ||||||||
| regression statistics | ||||||||
| multipl R .875179 | ||||||||
| r square .765938 | ||||||||
| adjusted r square .73668 | ||||||||
| standard error 3.802138 | ||||||||
| observations 10 | ||||||||
| anova | ||||||||
| df | ss | ms | f | significance f | ||||
| regression | 1 | 378.45 | 378.45 | 26.17898833 | 0.000911066 | |||
| residual | 8 | 115.65 | 14.45625 | |||||
| total | 9 | 494.1 | ||||||
| coefficient standard error | t stat | p-value | lower 95% | upper 95% | lower 95.0% | upper 95.0% | ||
| intercept | 75.4 | 2.082517 | 36.2062 | 3.71E-10 | 70.59770833 | 80.20229167 | 70.59770833 | 80.20229167 |
| X Variable 1 | -4.35 | 0.850184 | -5.11654 | 0.000911066 | -6.310527365 | -2.389472635 | -6.310527365 | -2.389472635 |
Solution
Well, I canno make out what exactly is required to be answered due to clumsyness of the question. But since you asked for r,p F values, I can provide what do they mean.
r= correlation coefficient between two variables under consideration,
p=p-value the estimated probability of false rejection of null hypothesis. Which if > chosen level of significance will lead to rejection of null hypothsis.
F= F-statistic used to test the significance of regression.

 Homework Sourse