Using a Punnett Square Using a Punnett Square A Punnett squa
Using a Punnett Square
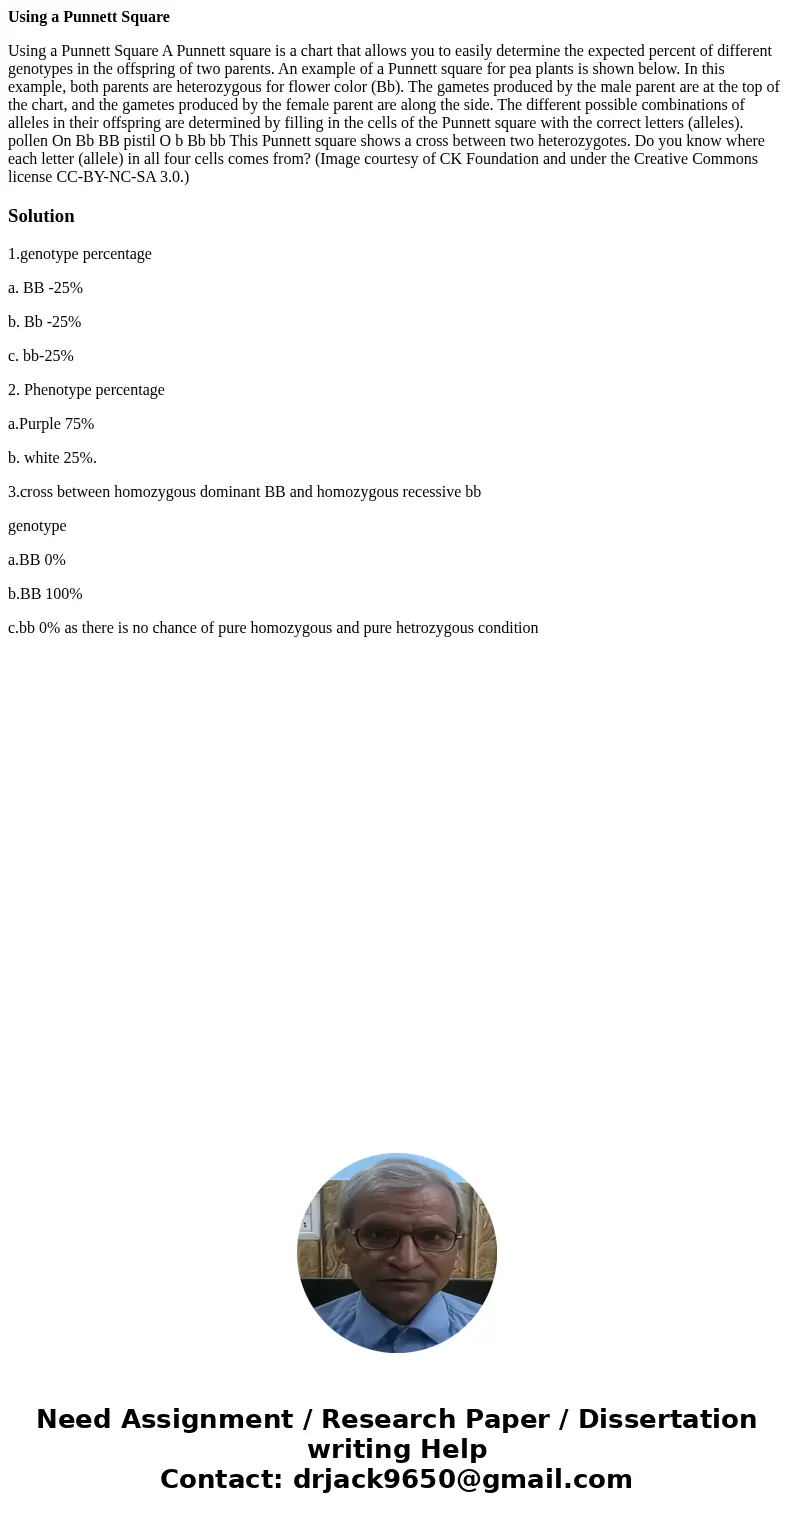
Using a Punnett Square A Punnett square is a chart that allows you to easily determine the expected percent of different genotypes in the offspring of two parents. An example of a Punnett square for pea plants is shown below. In this example, both parents are heterozygous for flower color (Bb). The gametes produced by the male parent are at the top of the chart, and the gametes produced by the female parent are along the side. The different possible combinations of alleles in their offspring are determined by filling in the cells of the Punnett square with the correct letters (alleles). pollen On Bb BB pistil O b Bb bb This Punnett square shows a cross between two heterozygotes. Do you know where each letter (allele) in all four cells comes from? (Image courtesy of CK Foundation and under the Creative Commons license CC-BY-NC-SA 3.0.)Solution
1.genotype percentage
a. BB -25%
b. Bb -25%
c. bb-25%
2. Phenotype percentage
a.Purple 75%
b. white 25%.
3.cross between homozygous dominant BB and homozygous recessive bb
genotype
a.BB 0%
b.BB 100%
c.bb 0% as there is no chance of pure homozygous and pure hetrozygous condition

 Homework Sourse