1 TCO 5 Answer the following questions using the Patient Fal
1. (TCO 5) Answer the following questions using the Patient Falls linear regression output table given below.
a. What is the equation of the line of best fit for this problem?
b. How strong is the relationship between the Period number and Patient Falls? Why did you reach that conclusion?
c. Is this model statistically significant? Why?
d. Make a prediction for period 17 using the data. Please show your work.
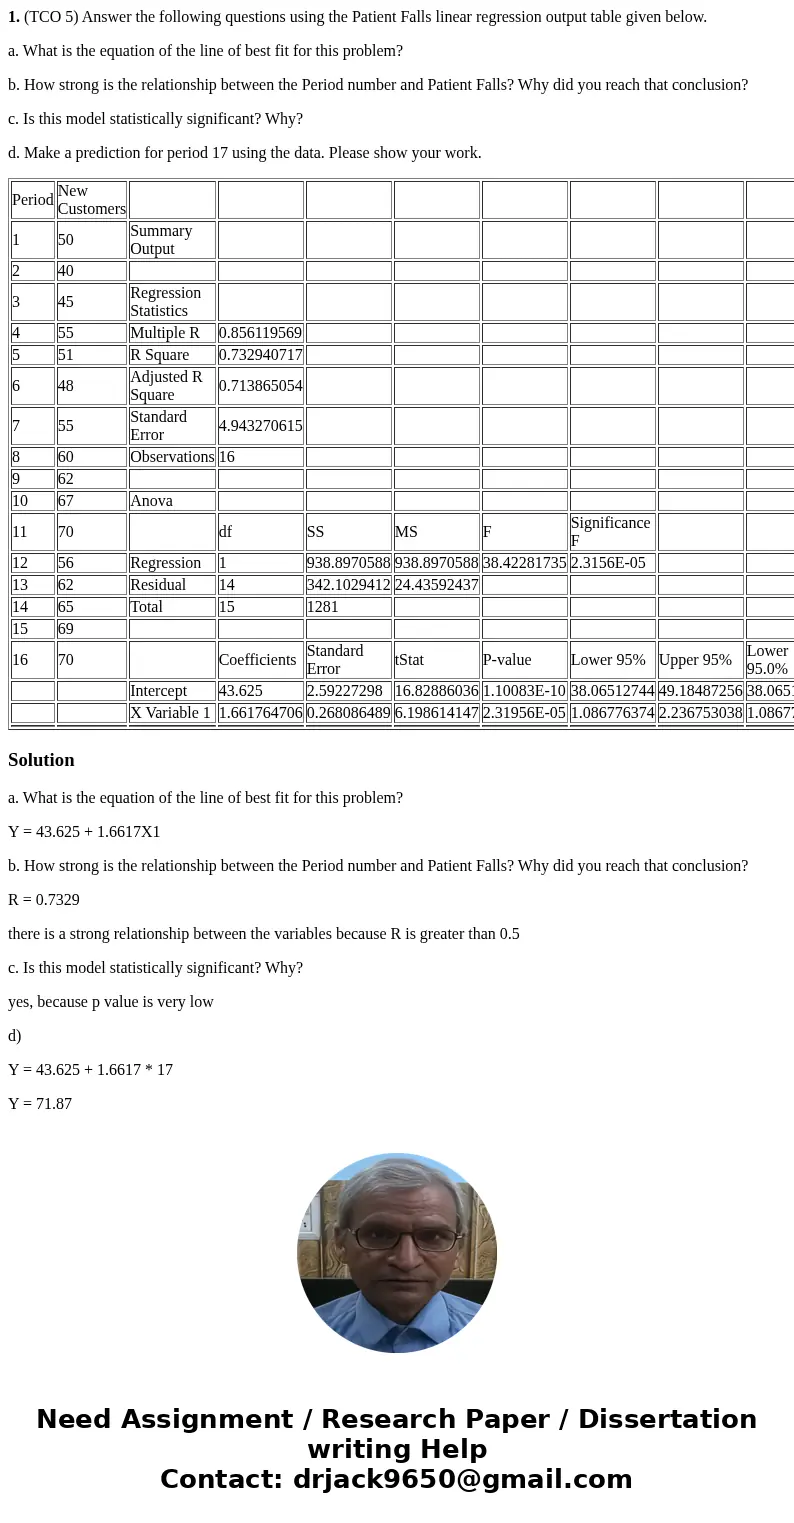
| Period | New Customers | |||||||||
| 1 | 50 | Summary Output | ||||||||
| 2 | 40 | |||||||||
| 3 | 45 | Regression Statistics | ||||||||
| 4 | 55 | Multiple R | 0.856119569 | |||||||
| 5 | 51 | R Square | 0.732940717 | |||||||
| 6 | 48 | Adjusted R Square | 0.713865054 | |||||||
| 7 | 55 | Standard Error | 4.943270615 | |||||||
| 8 | 60 | Observations | 16 | |||||||
| 9 | 62 | |||||||||
| 10 | 67 | Anova | ||||||||
| 11 | 70 | df | SS | MS | F | Significance F | ||||
| 12 | 56 | Regression | 1 | 938.8970588 | 938.8970588 | 38.42281735 | 2.3156E-05 | |||
| 13 | 62 | Residual | 14 | 342.1029412 | 24.43592437 | |||||
| 14 | 65 | Total | 15 | 1281 | ||||||
| 15 | 69 | |||||||||
| 16 | 70 | Coefficients | Standard Error | tStat | P-value | Lower 95% | Upper 95% | Lower 95.0% | Upper 95.0% | |
| Intercept | 43.625 | 2.59227298 | 16.82886036 | 1.10083E-10 | 38.06512744 | 49.18487256 | 38.06512744 | 49.18487256 | ||
| X Variable 1 | 1.661764706 | 0.268086489 | 6.198614147 | 2.31956E-05 | 1.086776374 | 2.236753038 | 1.086776374 | 2.236753038 | ||
Solution
a. What is the equation of the line of best fit for this problem?
Y = 43.625 + 1.6617X1
b. How strong is the relationship between the Period number and Patient Falls? Why did you reach that conclusion?
R = 0.7329
there is a strong relationship between the variables because R is greater than 0.5
c. Is this model statistically significant? Why?
yes, because p value is very low
d)
Y = 43.625 + 1.6617 * 17
Y = 71.87


 Homework Sourse