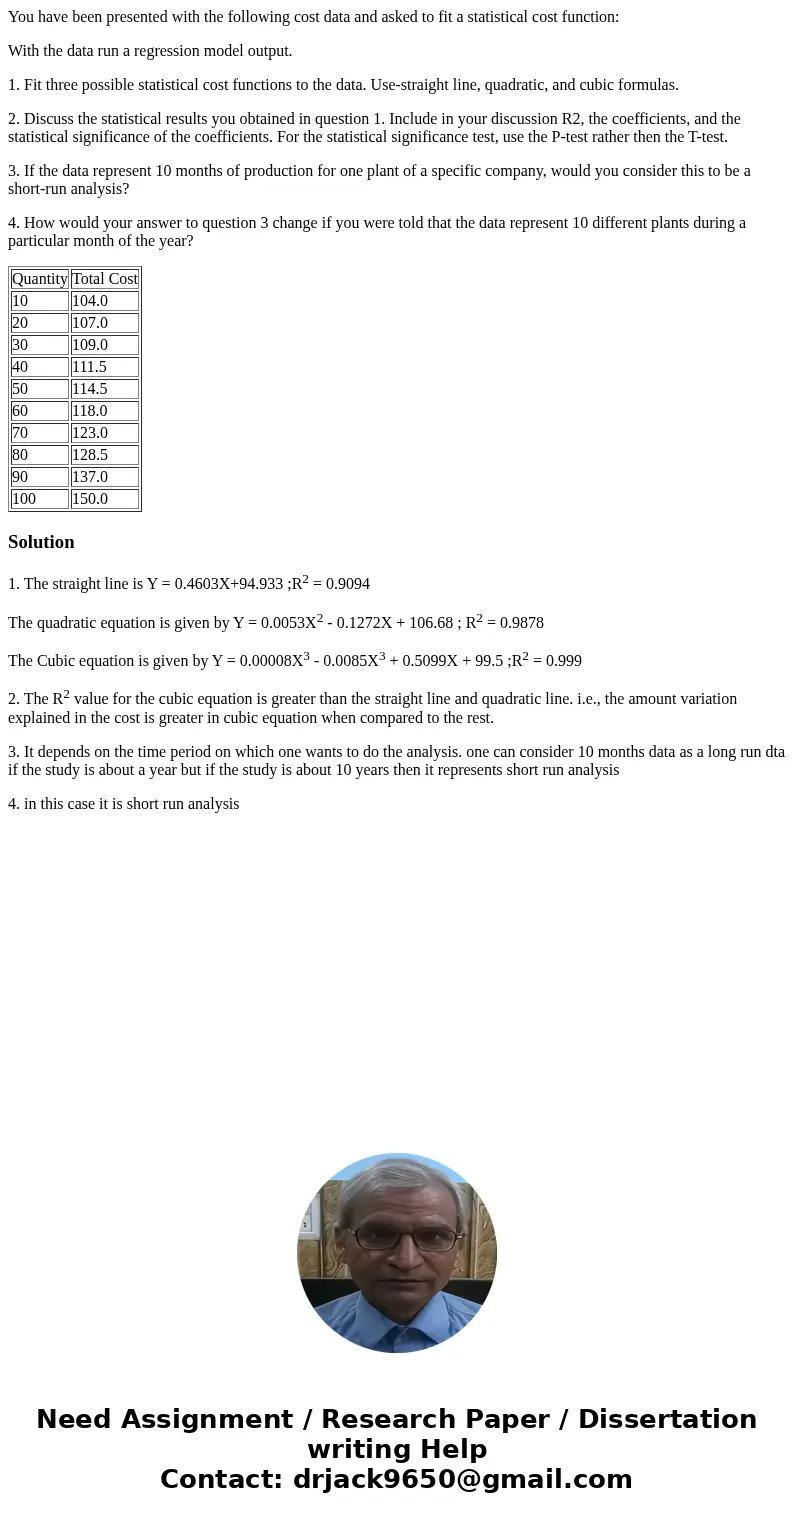
You have been presented with the following cost data and ask
You have been presented with the following cost data and asked to fit a statistical cost function:
With the data run a regression model output.
1. Fit three possible statistical cost functions to the data. Use-straight line, quadratic, and cubic formulas.
2. Discuss the statistical results you obtained in question 1. Include in your discussion R2, the coefficients, and the statistical significance of the coefficients. For the statistical significance test, use the P-test rather then the T-test.
3. If the data represent 10 months of production for one plant of a specific company, would you consider this to be a short-run analysis?
4. How would your answer to question 3 change if you were told that the data represent 10 different plants during a particular month of the year?
| Quantity | Total Cost |
| 10 | 104.0 |
| 20 | 107.0 |
| 30 | 109.0 |
| 40 | 111.5 |
| 50 | 114.5 |
| 60 | 118.0 |
| 70 | 123.0 |
| 80 | 128.5 |
| 90 | 137.0 |
| 100 | 150.0 |
Solution
1. The straight line is Y = 0.4603X+94.933 ;R2 = 0.9094
The quadratic equation is given by Y = 0.0053X2 - 0.1272X + 106.68 ; R2 = 0.9878
The Cubic equation is given by Y = 0.00008X3 - 0.0085X3 + 0.5099X + 99.5 ;R2 = 0.999
2. The R2 value for the cubic equation is greater than the straight line and quadratic line. i.e., the amount variation explained in the cost is greater in cubic equation when compared to the rest.
3. It depends on the time period on which one wants to do the analysis. one can consider 10 months data as a long run dta if the study is about a year but if the study is about 10 years then it represents short run analysis
4. in this case it is short run analysis

 Homework Sourse