Now we fit a linear regression model using R The code and ou
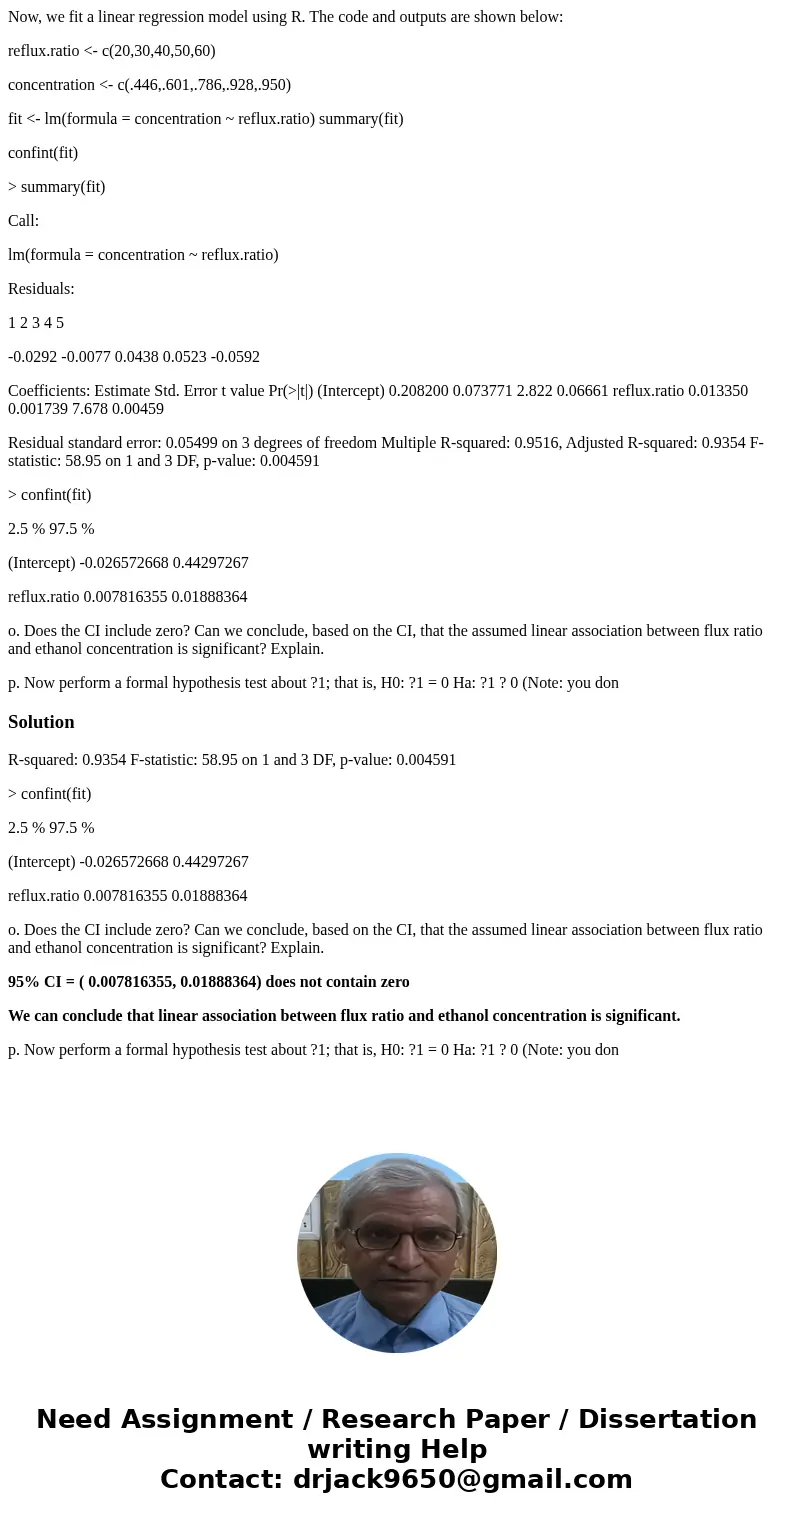
Now, we fit a linear regression model using R. The code and outputs are shown below:
reflux.ratio <- c(20,30,40,50,60)
concentration <- c(.446,.601,.786,.928,.950)
fit <- lm(formula = concentration ~ reflux.ratio) summary(fit)
confint(fit)
> summary(fit)
Call:
lm(formula = concentration ~ reflux.ratio)
Residuals:
1 2 3 4 5
-0.0292 -0.0077 0.0438 0.0523 -0.0592
Coefficients: Estimate Std. Error t value Pr(>|t|) (Intercept) 0.208200 0.073771 2.822 0.06661 reflux.ratio 0.013350 0.001739 7.678 0.00459
Residual standard error: 0.05499 on 3 degrees of freedom Multiple R-squared: 0.9516, Adjusted R-squared: 0.9354 F-statistic: 58.95 on 1 and 3 DF, p-value: 0.004591
> confint(fit)
2.5 % 97.5 %
(Intercept) -0.026572668 0.44297267
reflux.ratio 0.007816355 0.01888364
o. Does the CI include zero? Can we conclude, based on the CI, that the assumed linear association between flux ratio and ethanol concentration is significant? Explain.
p. Now perform a formal hypothesis test about ?1; that is, H0: ?1 = 0 Ha: ?1 ? 0 (Note: you don
Solution
R-squared: 0.9354 F-statistic: 58.95 on 1 and 3 DF, p-value: 0.004591
> confint(fit)
2.5 % 97.5 %
(Intercept) -0.026572668 0.44297267
reflux.ratio 0.007816355 0.01888364
o. Does the CI include zero? Can we conclude, based on the CI, that the assumed linear association between flux ratio and ethanol concentration is significant? Explain.
95% CI = ( 0.007816355, 0.01888364) does not contain zero
We can conclude that linear association between flux ratio and ethanol concentration is significant.
p. Now perform a formal hypothesis test about ?1; that is, H0: ?1 = 0 Ha: ?1 ? 0 (Note: you don

 Homework Sourse