Income Statement 2015 Sales Cost of Goods Sold Depreciation
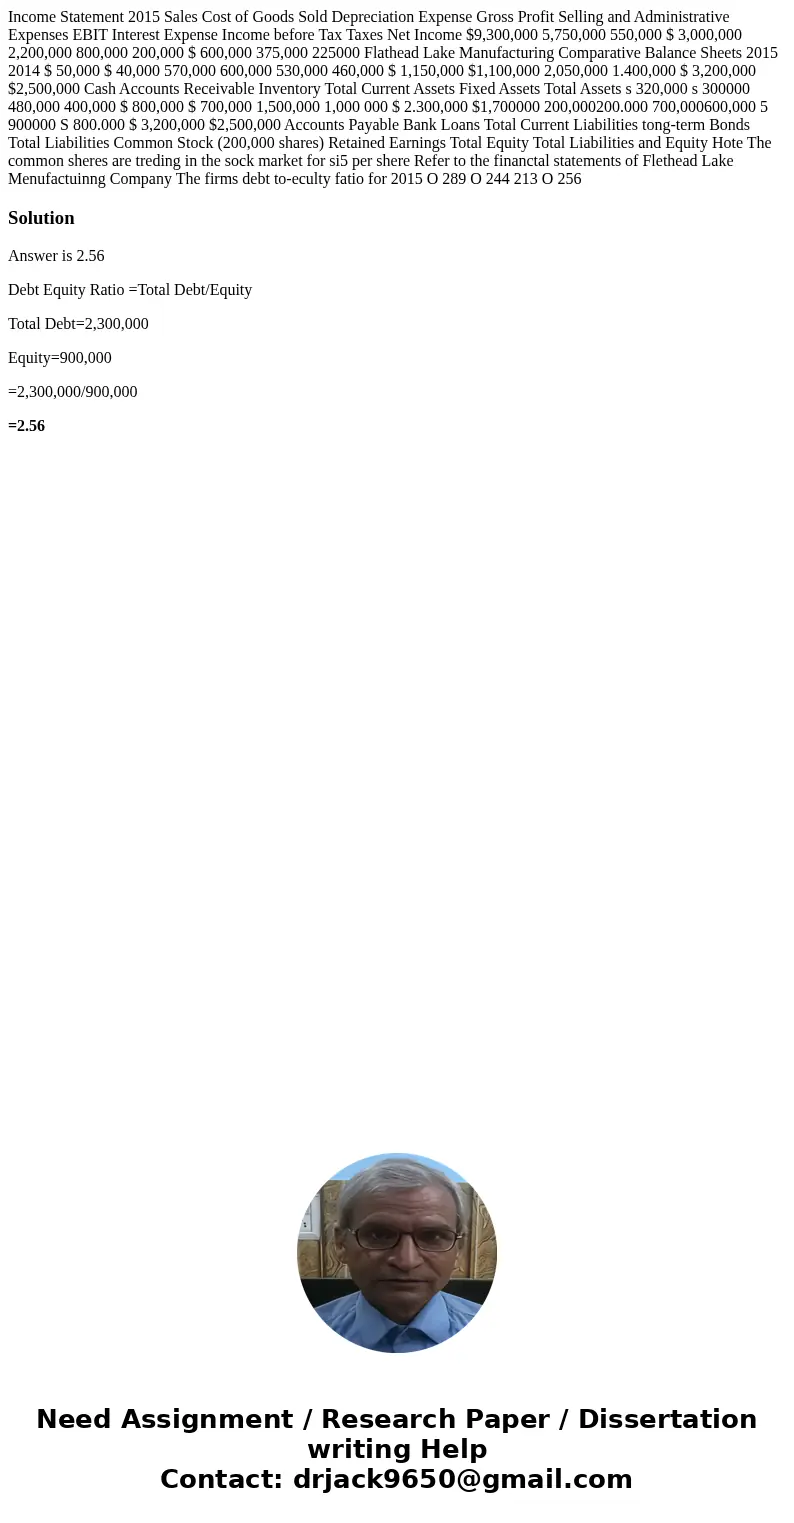
Income Statement 2015 Sales Cost of Goods Sold Depreciation Expense Gross Profit Selling and Administrative Expenses EBIT Interest Expense Income before Tax Taxes Net Income $9,300,000 5,750,000 550,000 $ 3,000,000 2,200,000 800,000 200,000 $ 600,000 375,000 225000 Flathead Lake Manufacturing Comparative Balance Sheets 2015 2014 $ 50,000 $ 40,000 570,000 600,000 530,000 460,000 $ 1,150,000 $1,100,000 2,050,000 1.400,000 $ 3,200,000 $2,500,000 Cash Accounts Receivable Inventory Total Current Assets Fixed Assets Total Assets s 320,000 s 300000 480,000 400,000 $ 800,000 $ 700,000 1,500,000 1,000 000 $ 2.300,000 $1,700000 200,000200.000 700,000600,000 5 900000 S 800.000 $ 3,200,000 $2,500,000 Accounts Payable Bank Loans Total Current Liabilities tong-term Bonds Total Liabilities Common Stock (200,000 shares) Retained Earnings Total Equity Total Liabilities and Equity Hote The common sheres are treding in the sock market for si5 per shere Refer to the financtal statements of Flethead Lake Menufactuinng Company The firms debt to-eculty fatio for 2015 O 289 O 244 213 O 256 
Solution
Answer is 2.56
Debt Equity Ratio =Total Debt/Equity
Total Debt=2,300,000
Equity=900,000
=2,300,000/900,000
=2.56

 Homework Sourse