Q1 and Q2 Steven Schmidt 1994 conducted a series of experime
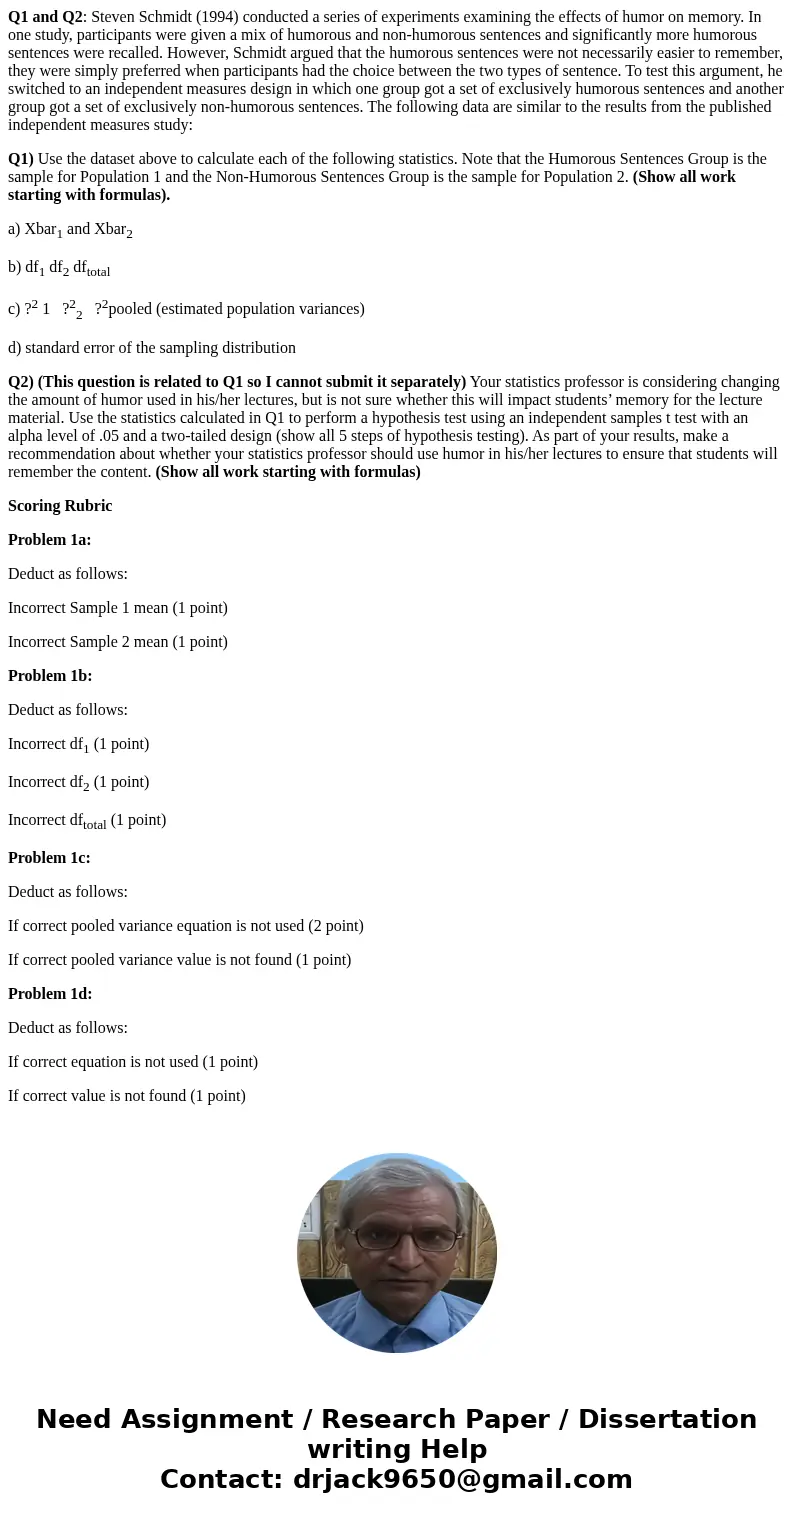
Q1 and Q2: Steven Schmidt (1994) conducted a series of experiments examining the effects of humor on memory. In one study, participants were given a mix of humorous and non-humorous sentences and significantly more humorous sentences were recalled. However, Schmidt argued that the humorous sentences were not necessarily easier to remember, they were simply preferred when participants had the choice between the two types of sentence. To test this argument, he switched to an independent measures design in which one group got a set of exclusively humorous sentences and another group got a set of exclusively non-humorous sentences. The following data are similar to the results from the published independent measures study:
Q1) Use the dataset above to calculate each of the following statistics. Note that the Humorous Sentences Group is the sample for Population 1 and the Non-Humorous Sentences Group is the sample for Population 2. (Show all work starting with formulas).
a) Xbar1 and Xbar2
b) df1 df2 dftotal
c) ?2 1 ?22 ?2pooled (estimated population variances)
d) standard error of the sampling distribution
Q2) (This question is related to Q1 so I cannot submit it separately) Your statistics professor is considering changing the amount of humor used in his/her lectures, but is not sure whether this will impact students’ memory for the lecture material. Use the statistics calculated in Q1 to perform a hypothesis test using an independent samples t test with an alpha level of .05 and a two-tailed design (show all 5 steps of hypothesis testing). As part of your results, make a recommendation about whether your statistics professor should use humor in his/her lectures to ensure that students will remember the content. (Show all work starting with formulas)
Scoring Rubric
Problem 1a:
Deduct as follows:
Incorrect Sample 1 mean (1 point)
Incorrect Sample 2 mean (1 point)
Problem 1b:
Deduct as follows:
Incorrect df1 (1 point)
Incorrect df2 (1 point)
Incorrect dftotal (1 point)
Problem 1c:
Deduct as follows:
If correct pooled variance equation is not used (2 point)
If correct pooled variance value is not found (1 point)
Problem 1d:
Deduct as follows:
If correct equation is not used (1 point)
If correct value is not found (1 point)
Problem 1e:
Deduct as follows:
If correct equation is not used (1 point)
If correct value is not found (1 point)
Problem 2 (12 points):
1.)State the hypothesis
Deduct as follows:
A.If any aspect of null hypothesis written in words is incorrect, be sure students are specifically
naming the IV and DV (.5 point)
B.If any aspect of null hypothesis written in notation is incorrect (.5 point)
C.If any aspect of alternative hypothesis written in words is incorrect, be sure students are specifically
naming the IV and DV (.5 point)
D.If any aspect of alternative hypothesis written in notation is incorrect (.5 point)
2.)Calculate standard error
Deduct as follows:
A.If correct value is not found per Question 1 (1 points)
3.)Determine critical value
Deduct as follows:
A. If the critical value is not correct (1 points)
4.)Conduct hypothesis test
Deduct as follows:
A.If correct t test equation is not used (1 points)
B.If correct t statistic is not found (1 points)
C.If t obtained is not compared to t critical in some form – words or notation (1 point)
5.) Make decision about rejecting/failing to reject the hypothesis
Deduct as follows:
A.If student does not explicitly state either “reject the hypothesis” or “fail to reject the null hypothesis” (1 point)
B.If student does not write correct conclusion in words (1 points)
C.If student does not write correct conclusion in notation (1 points)
D.If student does not correctly apply their results by making a decision about incorporation of humor into the professor’s lectures (2 points)
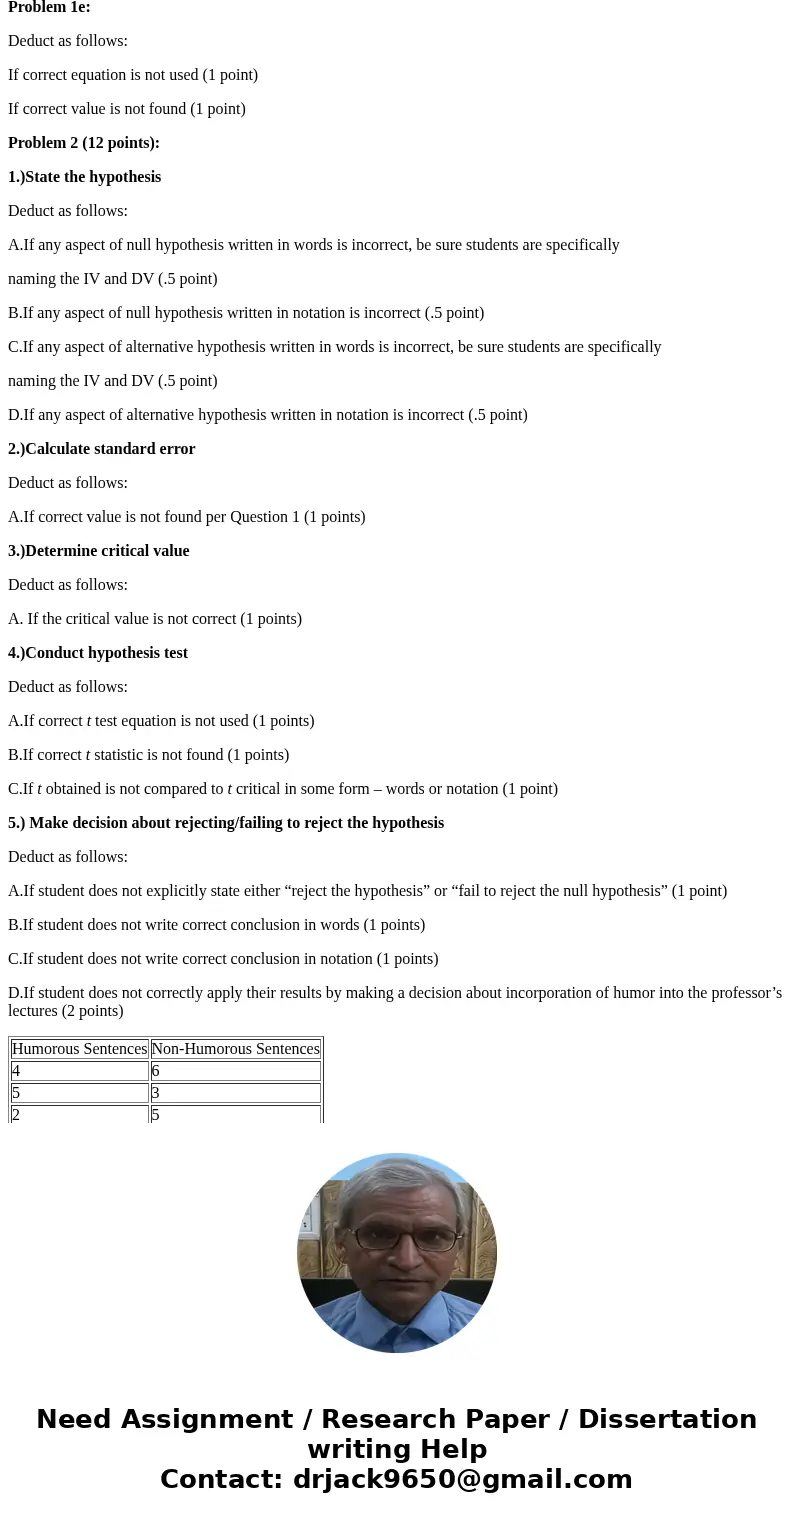
| Humorous Sentences | Non-Humorous Sentences |
| 4 | 6 |
| 5 | 3 |
| 2 | 5 |
| 4 | 3 |
| 6 | 3 |
| 7 | 4 |
| 6 | 2 |
| 6 | 6 |
| 2 | 4 |
| 5 | 3 |
| 4 | 4 |
| 3 | 4 |
| 3 | 5 |
| 3 | 2 |
| 5 | 6 |
| 3 | 4 |
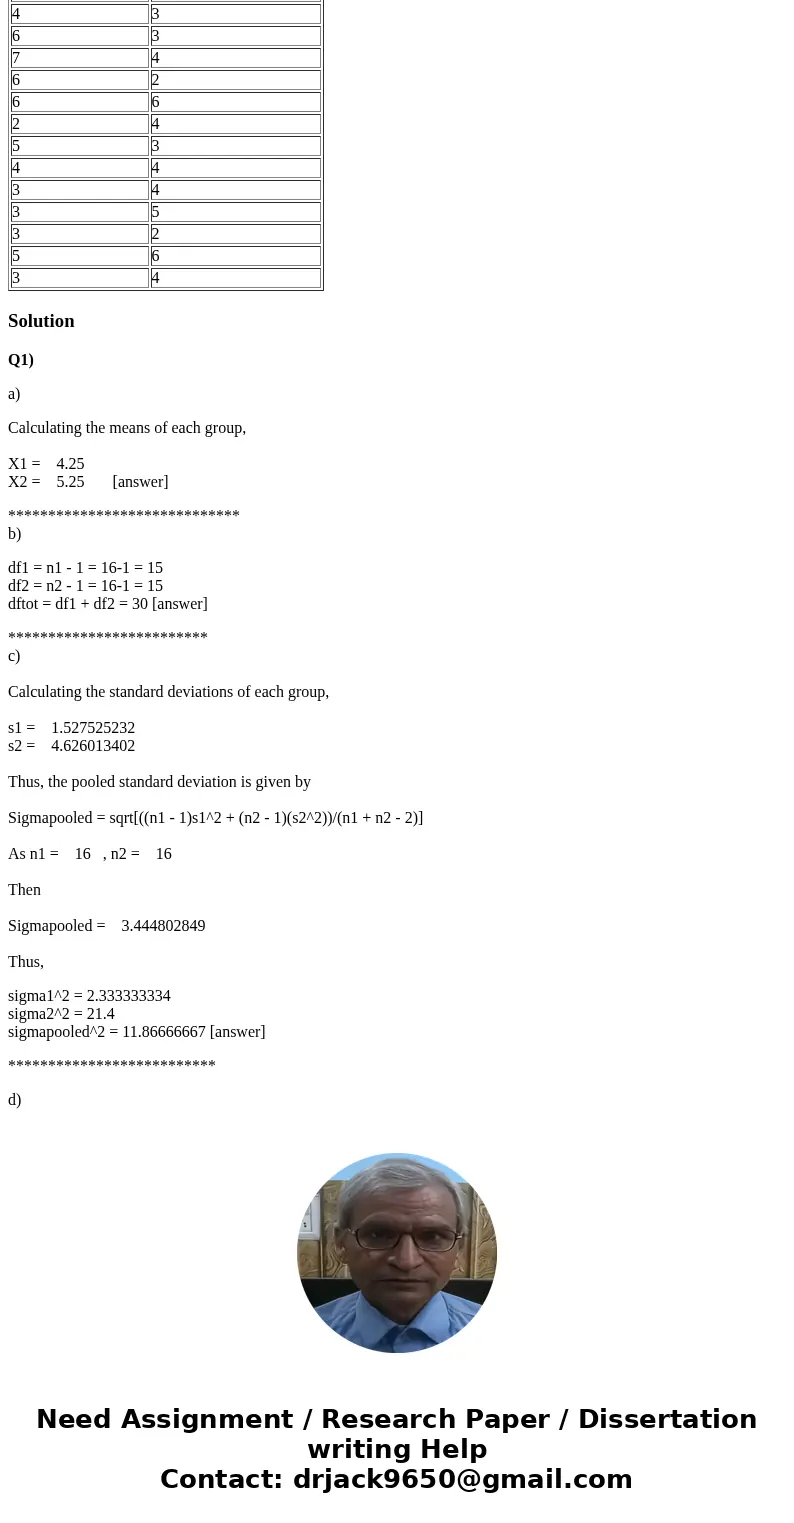
Solution
Q1)
a)
Calculating the means of each group,
X1 = 4.25
X2 = 5.25 [answer]
*****************************
b)
df1 = n1 - 1 = 16-1 = 15
df2 = n2 - 1 = 16-1 = 15
dftot = df1 + df2 = 30 [answer]
*************************
c)
Calculating the standard deviations of each group,
s1 = 1.527525232
s2 = 4.626013402
Thus, the pooled standard deviation is given by
Sigmapooled = sqrt[((n1 - 1)s1^2 + (n2 - 1)(s2^2))/(n1 + n2 - 2)]
As n1 = 16 , n2 = 16
Then
Sigmapooled = 3.444802849
Thus,
sigma1^2 = 2.333333334
sigma2^2 = 21.4
sigmapooled^2 = 11.86666667 [answer]
**************************
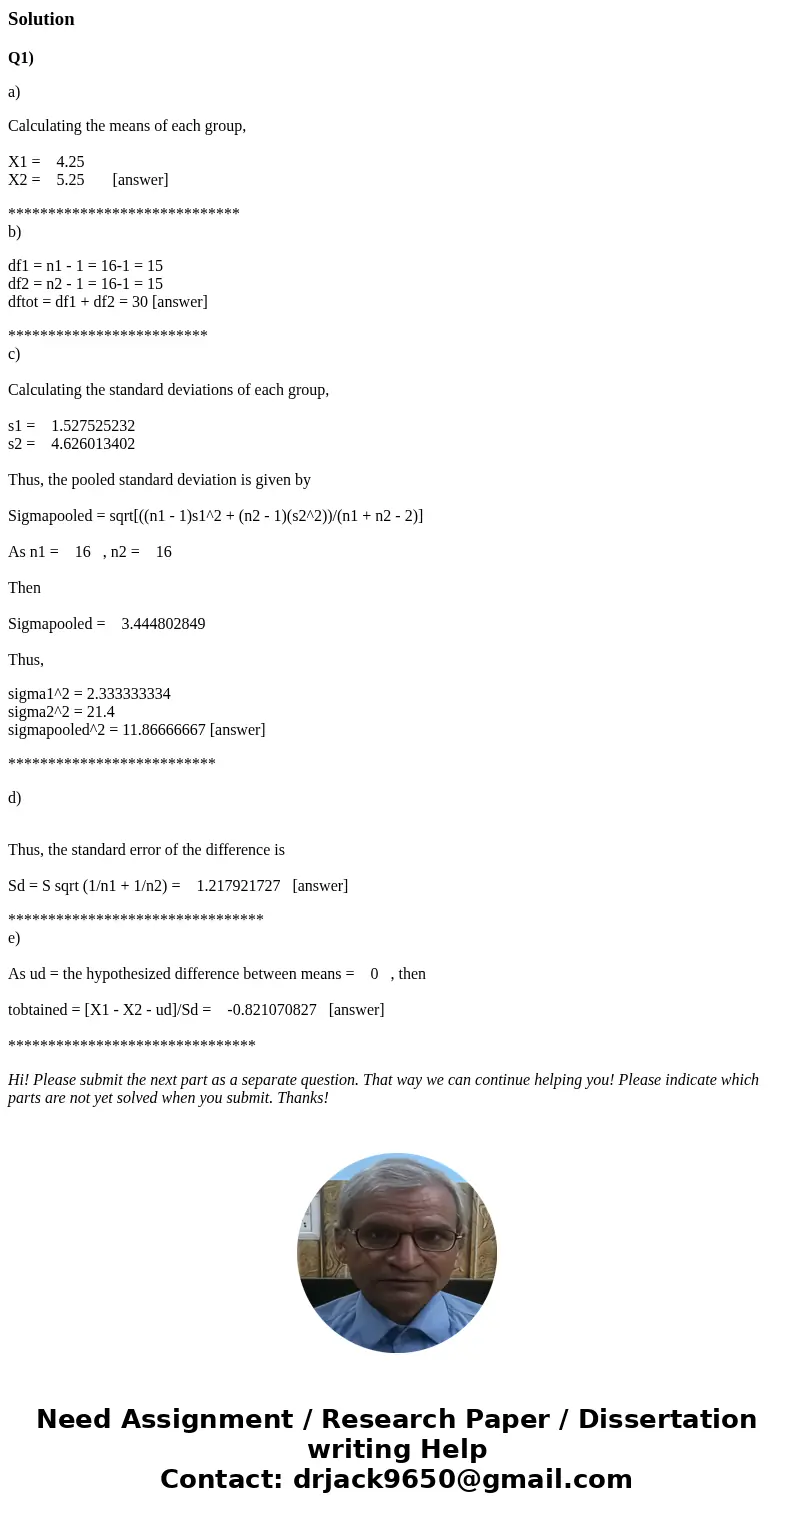
d)
Thus, the standard error of the difference is
Sd = S sqrt (1/n1 + 1/n2) = 1.217921727 [answer]
********************************
e)
As ud = the hypothesized difference between means = 0 , then
tobtained = [X1 - X2 - ud]/Sd = -0.821070827 [answer]
*******************************
Hi! Please submit the next part as a separate question. That way we can continue helping you! Please indicate which parts are not yet solved when you submit. Thanks!


 Homework Sourse