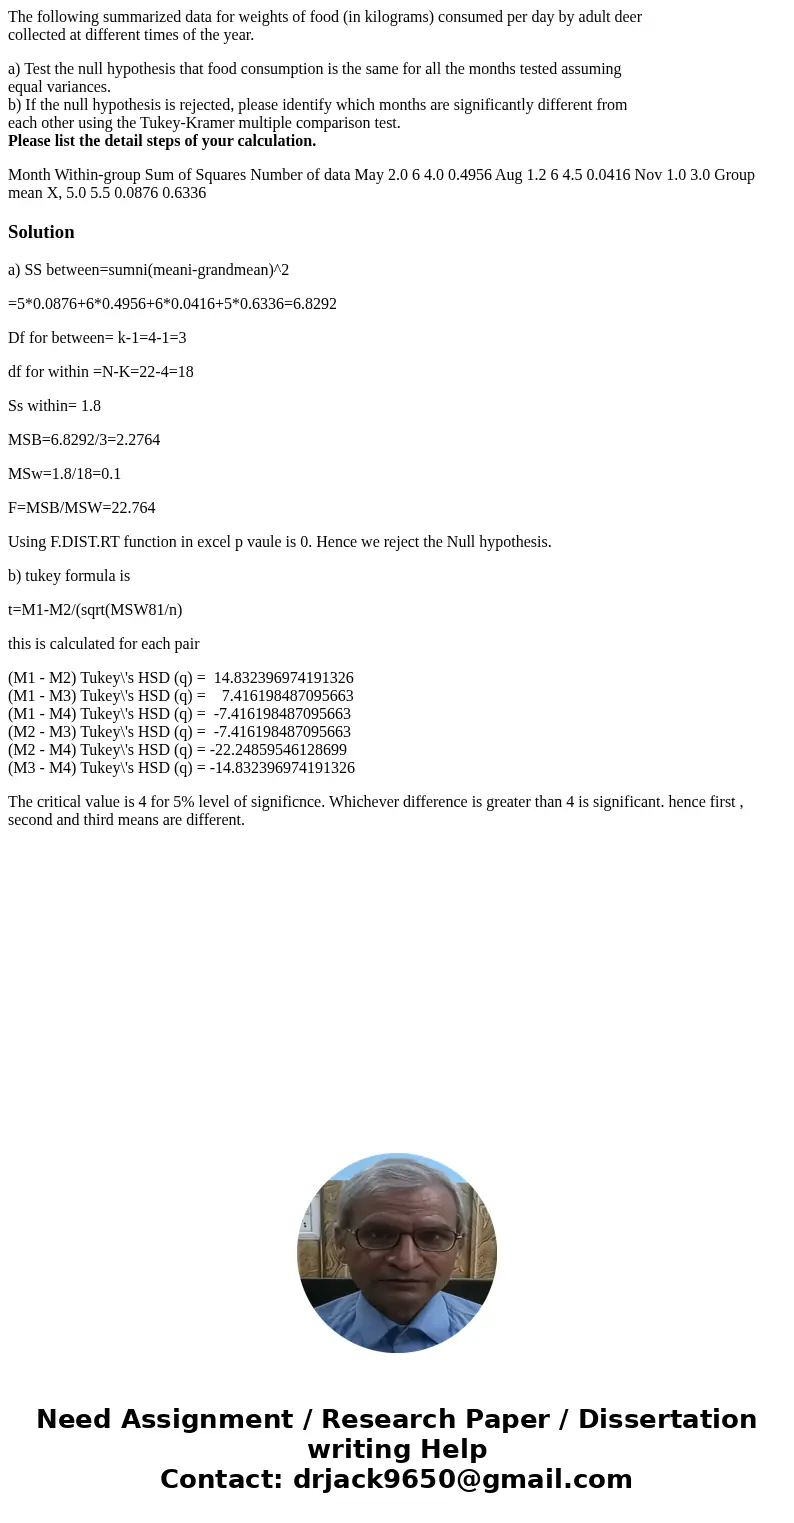
The following summarized data for weights of food in kilogra
The following summarized data for weights of food (in kilograms) consumed per day by adult deer
collected at different times of the year.
a) Test the null hypothesis that food consumption is the same for all the months tested assuming
equal variances.
b) If the null hypothesis is rejected, please identify which months are significantly different from
each other using the Tukey-Kramer multiple comparison test.
Please list the detail steps of your calculation.
Solution
a) SS between=sumni(meani-grandmean)^2
=5*0.0876+6*0.4956+6*0.0416+5*0.6336=6.8292
Df for between= k-1=4-1=3
df for within =N-K=22-4=18
Ss within= 1.8
MSB=6.8292/3=2.2764
MSw=1.8/18=0.1
F=MSB/MSW=22.764
Using F.DIST.RT function in excel p vaule is 0. Hence we reject the Null hypothesis.
b) tukey formula is
t=M1-M2/(sqrt(MSW81/n)
this is calculated for each pair
(M1 - M2) Tukey\'s HSD (q) = 14.832396974191326
(M1 - M3) Tukey\'s HSD (q) = 7.416198487095663
(M1 - M4) Tukey\'s HSD (q) = -7.416198487095663
(M2 - M3) Tukey\'s HSD (q) = -7.416198487095663
(M2 - M4) Tukey\'s HSD (q) = -22.24859546128699
(M3 - M4) Tukey\'s HSD (q) = -14.832396974191326
The critical value is 4 for 5% level of significnce. Whichever difference is greater than 4 is significant. hence first , second and third means are different.

 Homework Sourse